Power BI is a collection of software services, apps, and connectors that work together to turn your unrelated sources of data into coherent, visually immersive, and interactive insights. Your data may be an Excel spreadsheet, or a collection of cloud-based and on-premises hybrid data warehouses. Power BI lets you easily connect to your data sources, visualize and discover what's important, and share that with anyone or everyone you want.
Parts of Power BI
Power BI consists of several elements that all work together, starting with these three basics:
- A Windows desktop application called Power BI Desktop.
- An online SaaS (Software as a Service) service called the Power BI service.
- Power BI mobile apps for Windows, iOS, and Android devices.
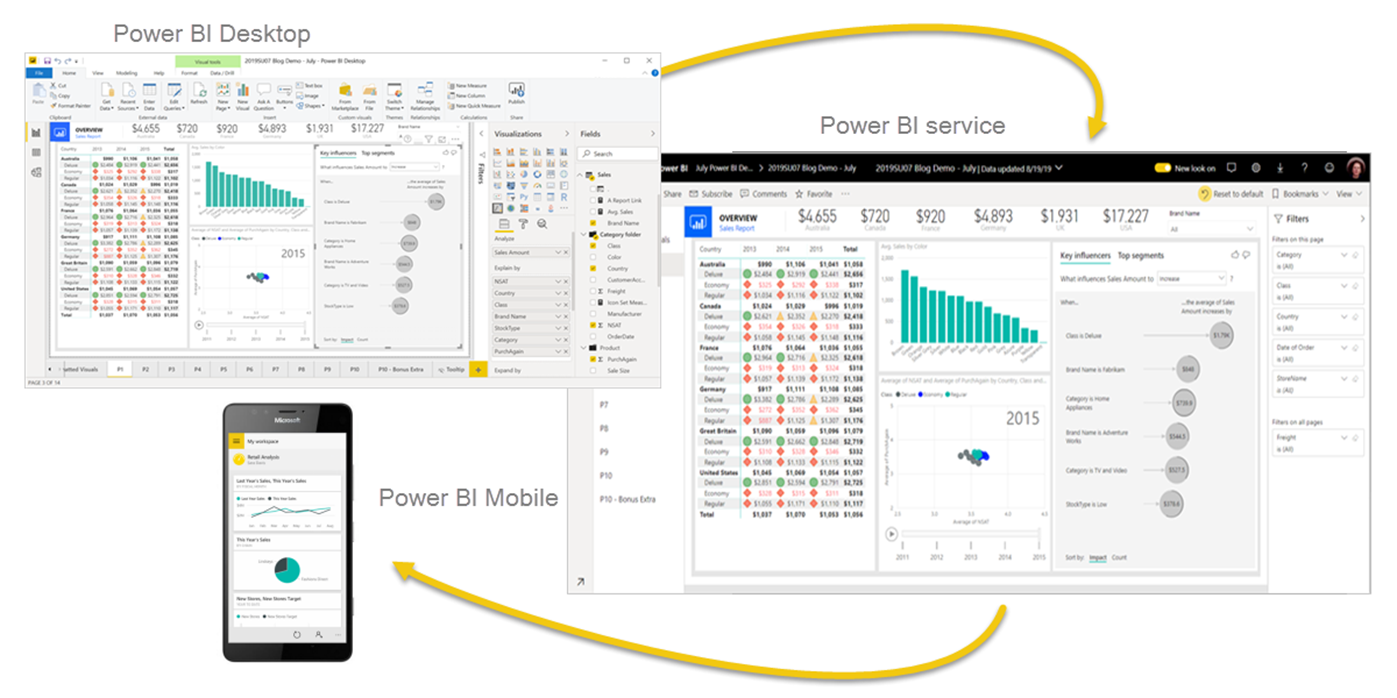
These three elements—Power BI Desktop, the service, and the mobile apps—are designed to let you create, share, and consume business insights in the way that serves you and your role most effectively.
Beyond those three, Power BI also features two other elements:
- Power BI Report Builder, for creating paginated reports to share in the Power BI service. Read more about paginated reports later in this article.
- Power BI Report Server, an on-premises report server where you can publish your Power BI reports, after creating them in Power BI Desktop. Read more about Power BI Report Server later in this article.
Power BI Desktop
Power BI Desktop integrates proven Microsoft query engine, data modeling, and visualization technologies. Data analysts and others can create collections of queries, data connections, models, and reports, and easily share them with others. Through the combination of Power BI Desktop and the Power BI service, new insights from the world of data are easier to model, build, share, and extend.
Power BI Desktop centralizes, simplifies, and streamlines what can otherwise be a scattered, disconnected, and arduous process of designing and creating business intelligence repositories and reports. Ready to give it a try? Let's get started.
With Power BI Desktop, you can:
- Connect to data, including multiple data sources.
- Shape the data with queries that build insightful, compelling data models.
- Use the data models to create visualizations and reports.
- Share your report files for others to leverage, build upon, and share. You can share Power BI Desktop .pbix files like any other files, but the most compelling method is to upload them to the Power BI service.
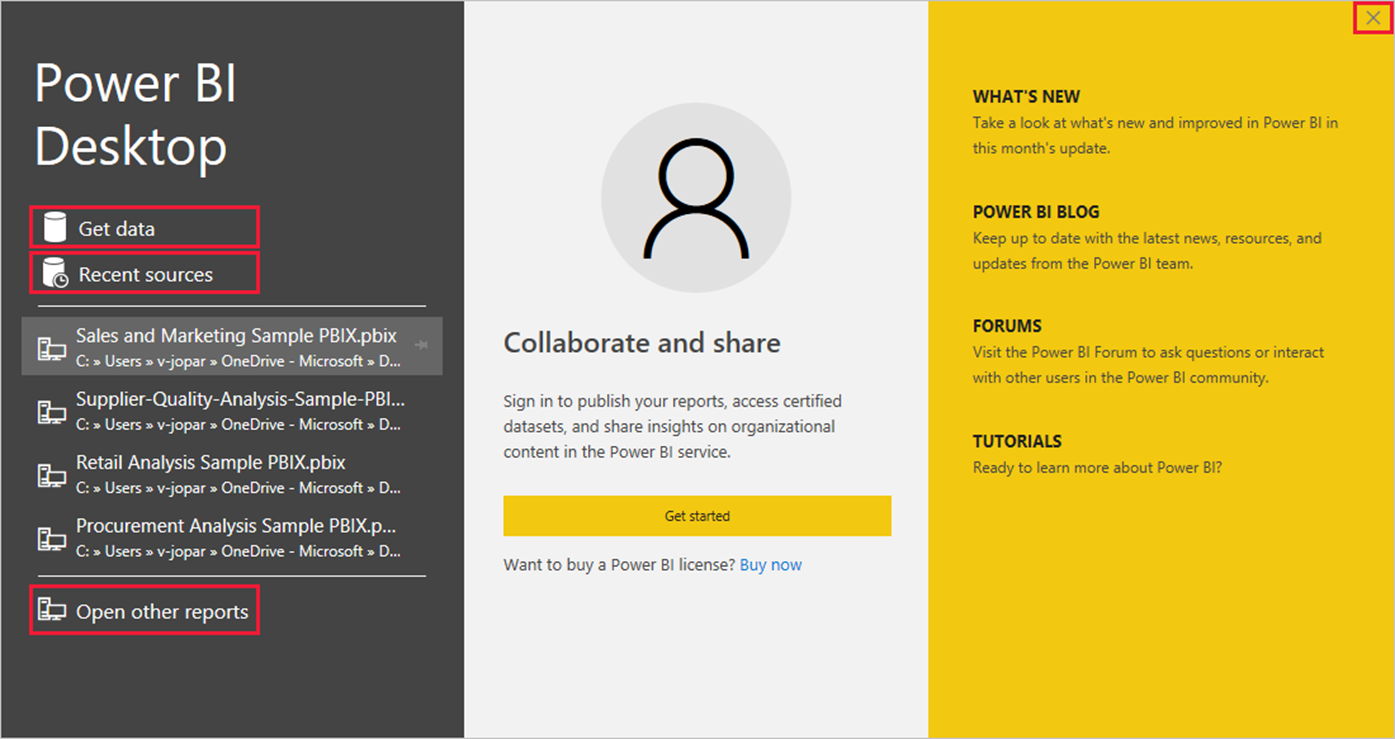
From the Welcome screen, you can Get data, see Recent sources, open recent reports, Open other reports, or select other links. Select the close icon to close the Welcome screen.
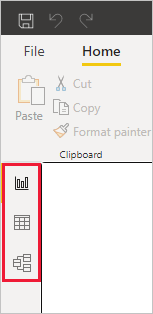
Along the left side of Power BI Desktop are icons for the three Power BI Desktop views: Report, Data, and Model, from top to bottom. The current view is indicated by the yellow bar along the left, and you can change views by selecting any of the icons.
Power BI Desktop also includes the Power Query Editor, which opens in a separate window. In Power Query Editor, you can build queries and transform data, then load the refined data model into Power BI Desktop to create reports.
Connect to data
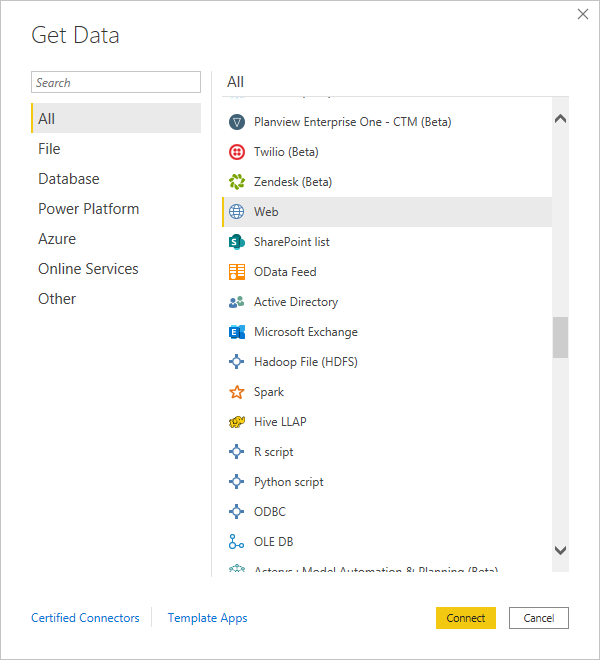
With Power BI Desktop installed, you're ready to connect to the ever-expanding world of data. To see the many types of data sources available, select Get Data > More in the Power BI Desktop Home tab, and in the Get Data window, scroll through the list of All data sources. In this quick tour, you connect to a couple of different Web data sources.
Imagine you're a data analyst working for a sunglasses retailer. You want to help your client target sunglasses sales where the sun shines most frequently. The Bankrate.com Best and worst states for retirement page has interesting data on this subject.
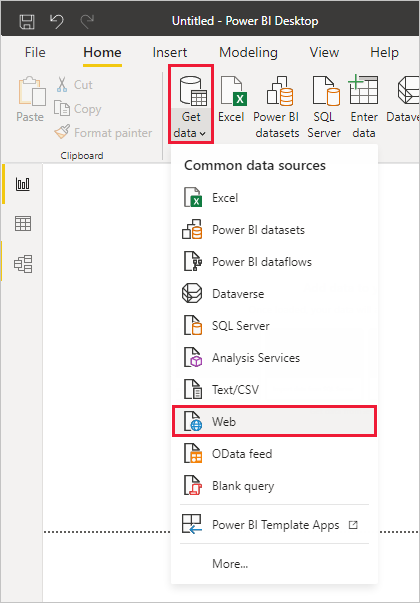
On the Power BI Desktop Home tab, select Get Data > Web to connect to a web data source.
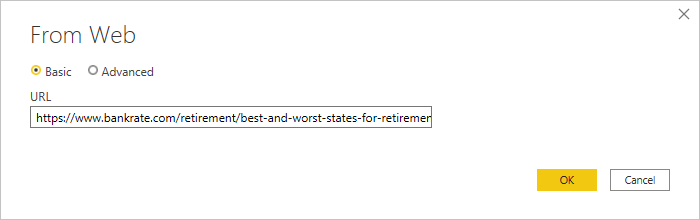
In the From Web dialog box, paste the address https://www.bankrate.com/retirement/best-and-worst-states-for-retirement/ into the URL field, and select OK.
If prompted, on the Access Web Content screen, select Connect to use anonymous access.
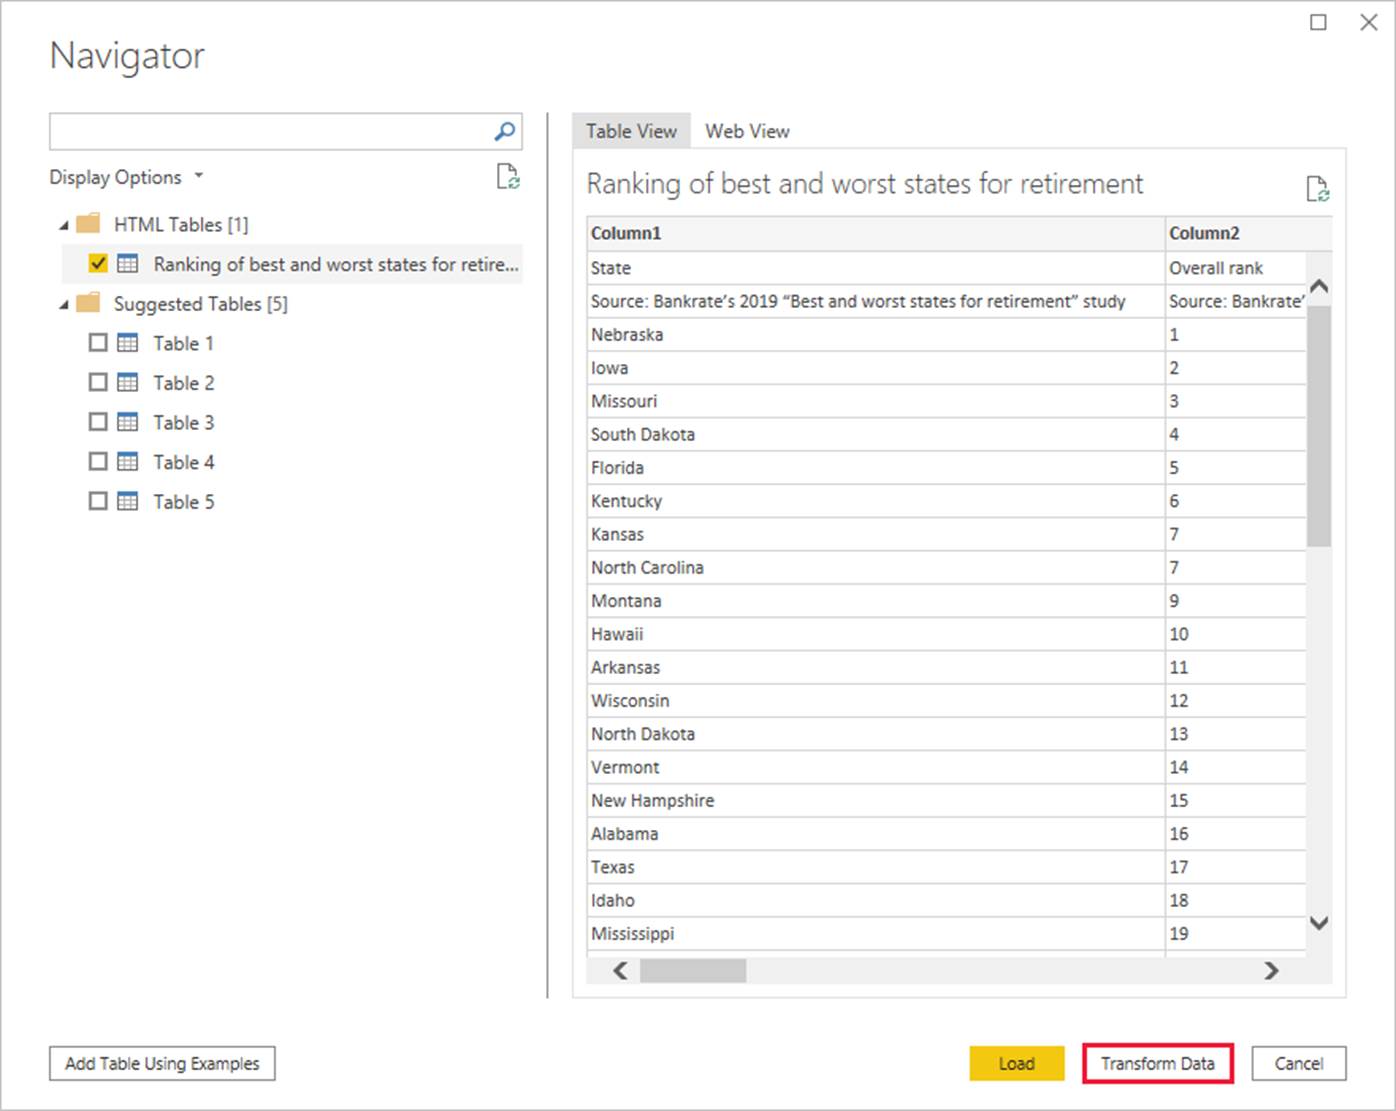
The query functionality of Power BI Desktop goes to work and contacts the web resource. The Navigator window returns what it found on the web page, in this case an HTML table called Ranking of best and worst states for retirement, and five other suggested tables. You're interested in the HTML table, so select it to see a preview.
At this point you can select Load to load the table, or Transform data to make changes in the table before you load it.
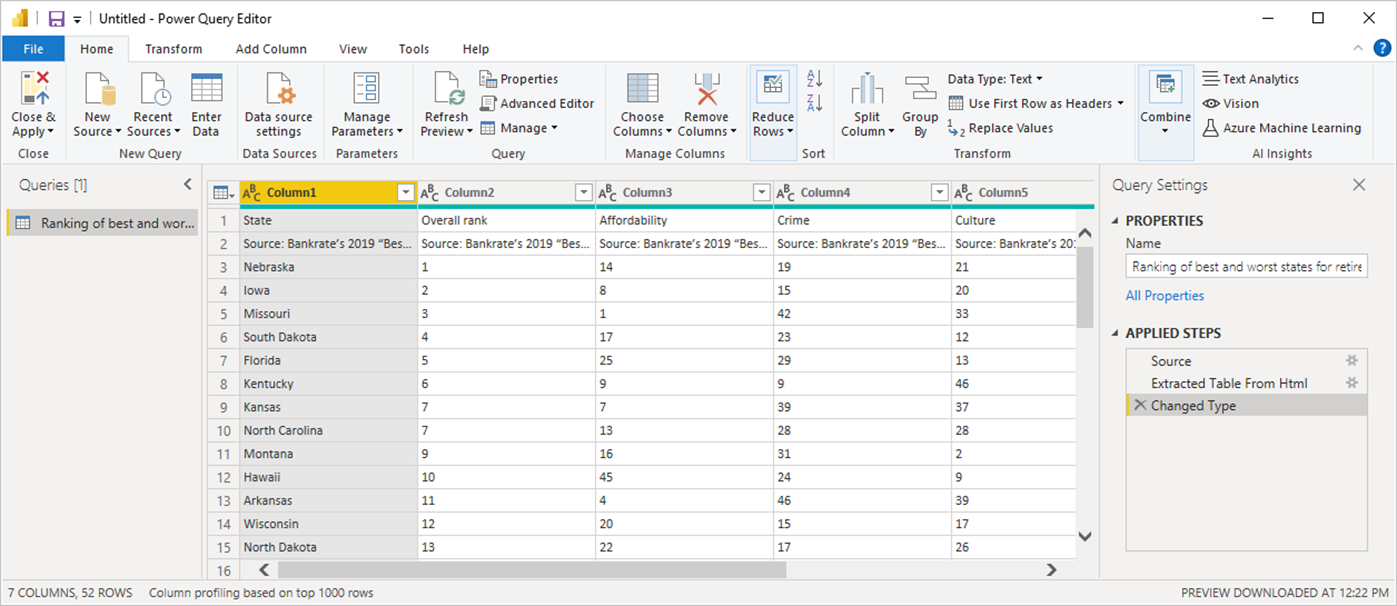
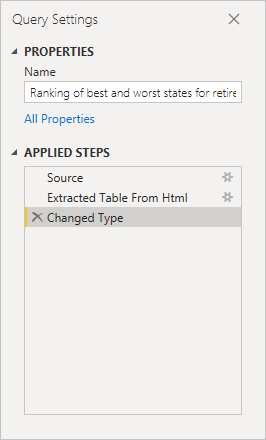
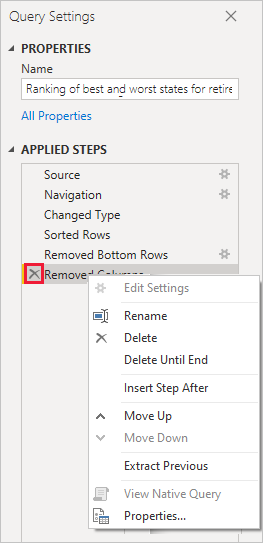
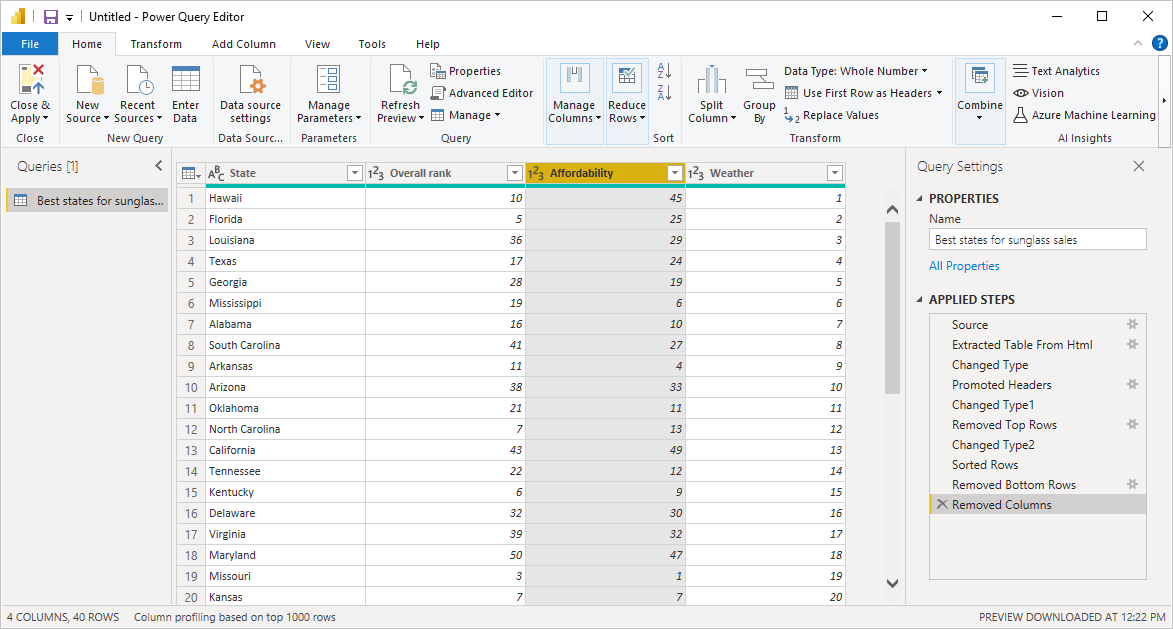
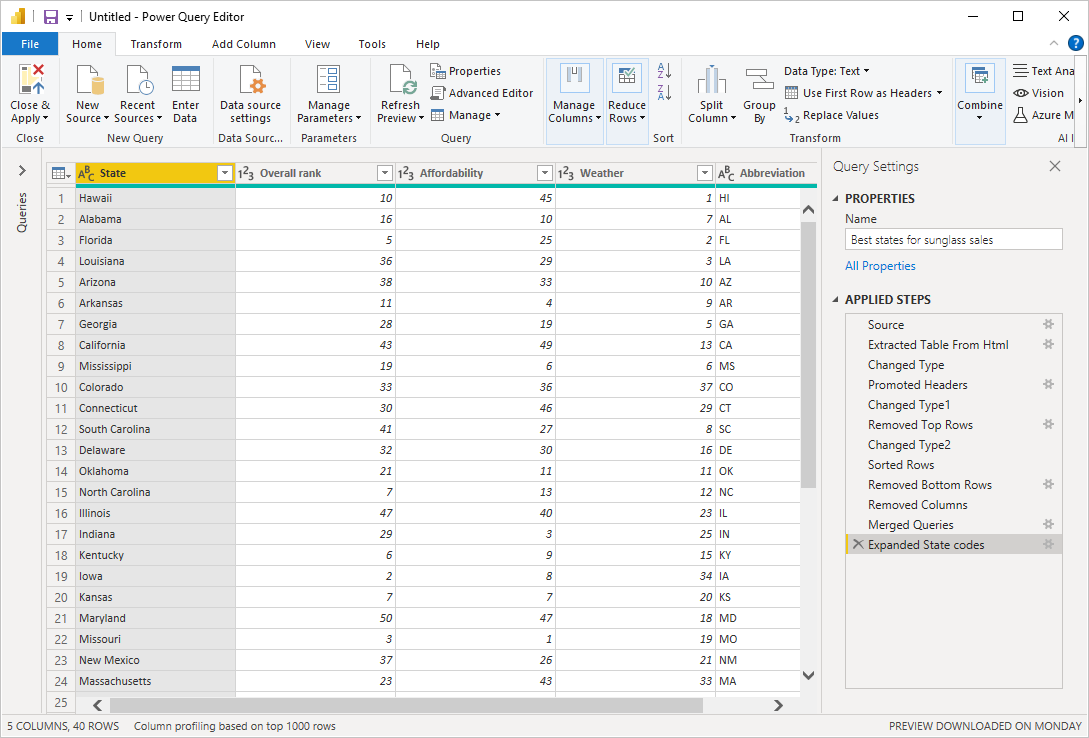
When you select Transform data, Power Query Editor launches, with a representative view of the table. The Query Settings pane is on the right, or you can always show it by selecting Query Settings on the View tab of Power Query Editor.
Shape data
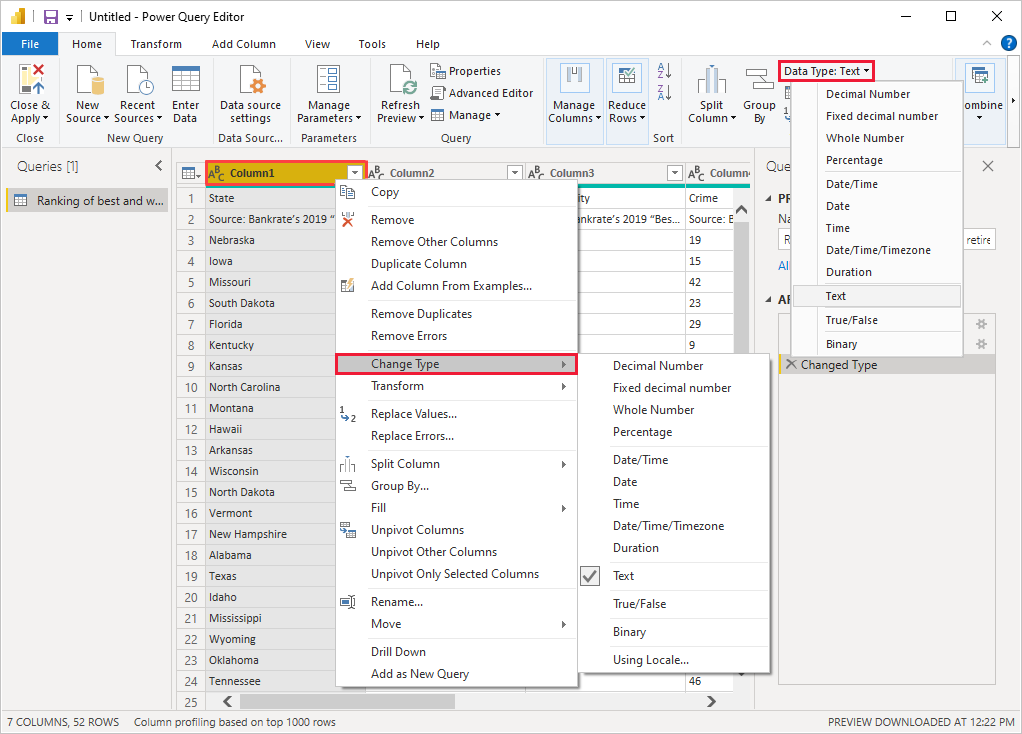
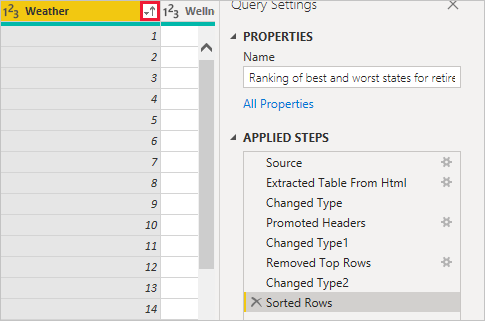
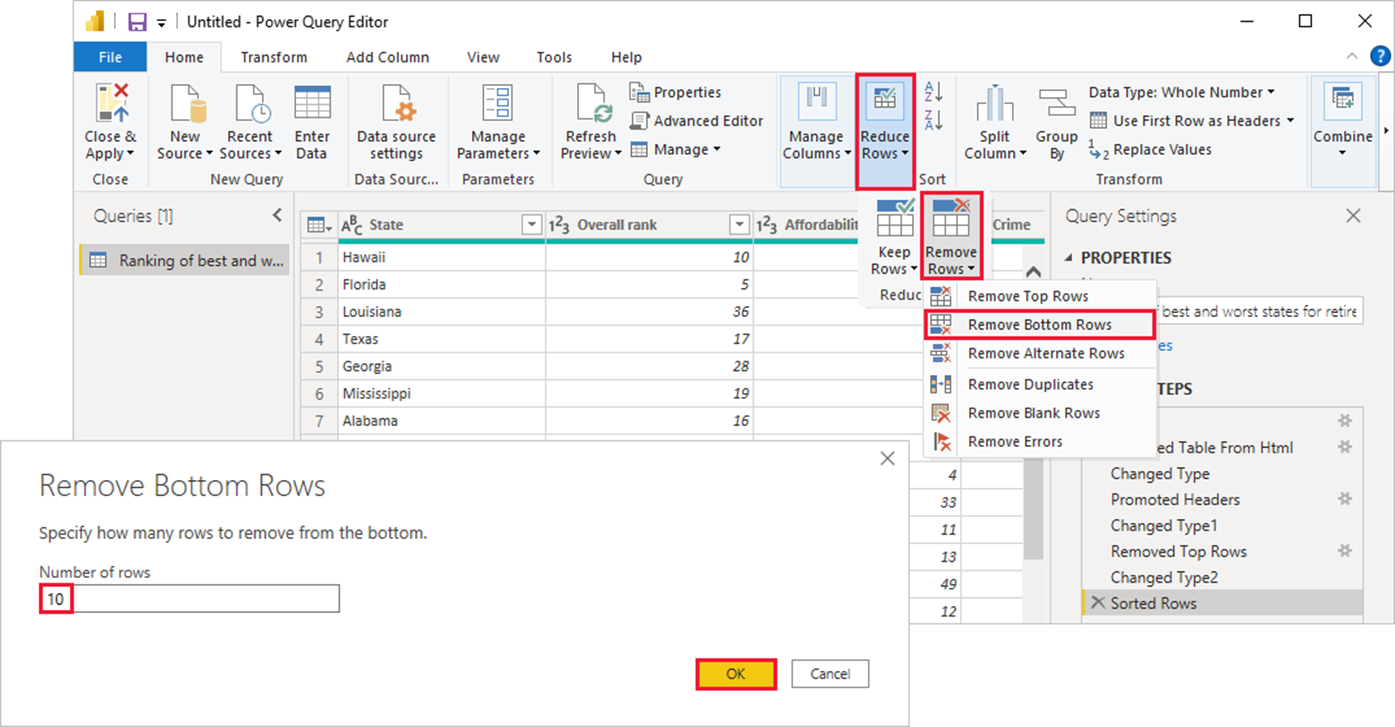
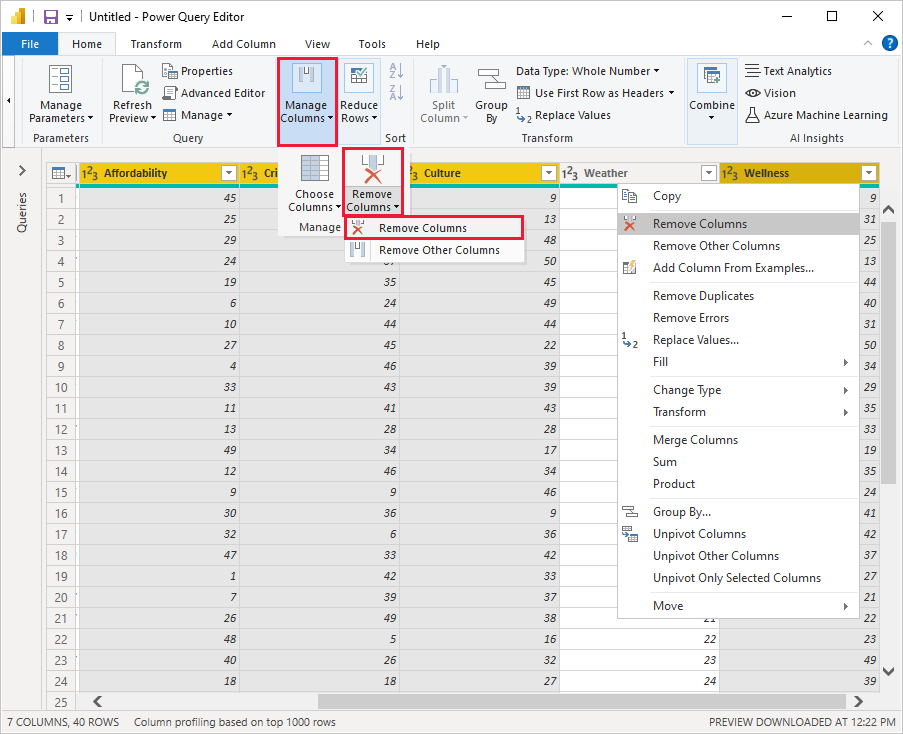
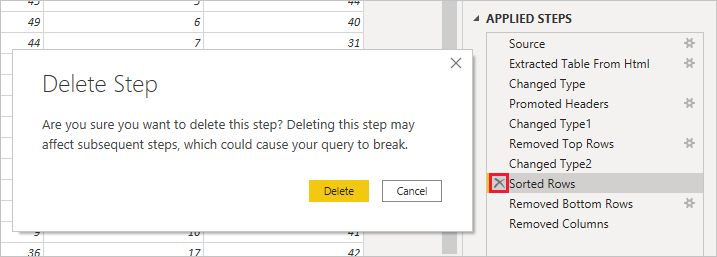
Now that you're connected to a data source, you can adjust the data to meet your needs. To shape data, you provide Power Query Editor with step-by-step instructions for adjusting the data while loading and presenting it. Shaping doesn't affect the original data source, only this particular view of the data.
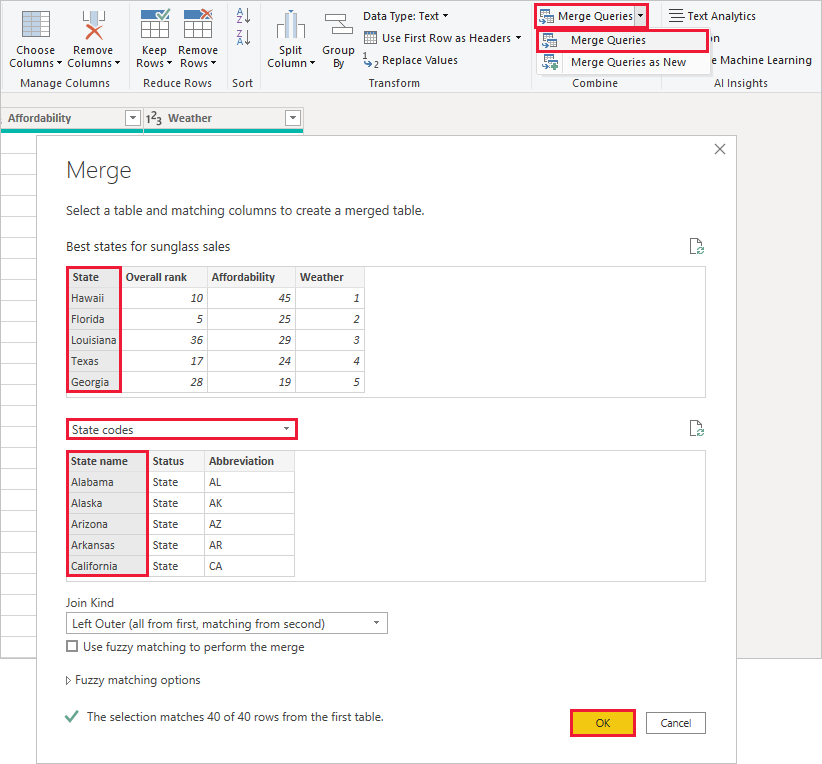
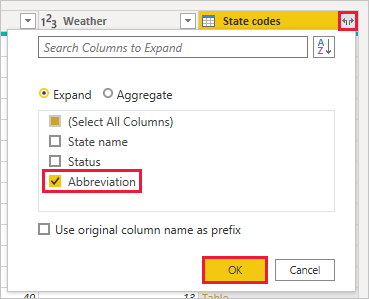
Combine data
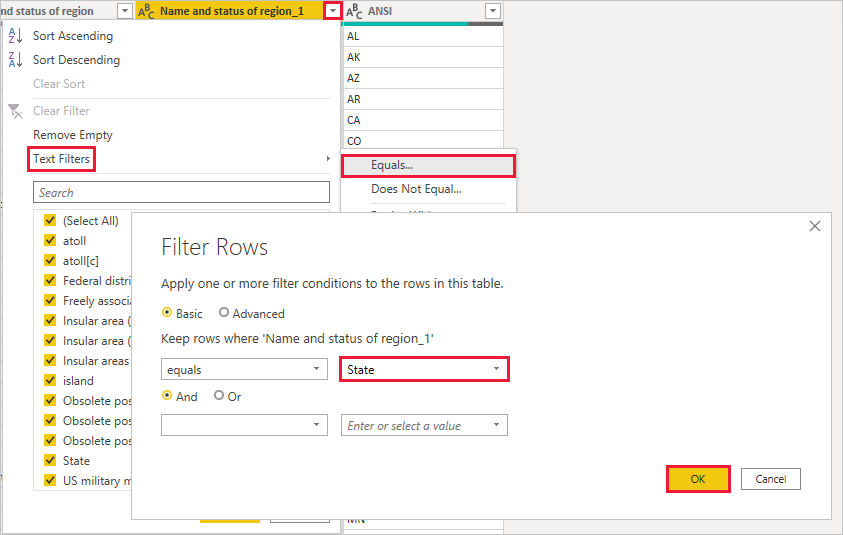
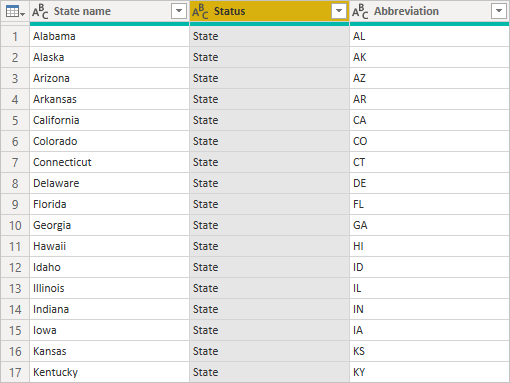
The data about various states is interesting, and will be useful for building additional analysis efforts and queries. But there's one problem: most data out there uses two-letter abbreviations for state codes, not the full names of the states. To use that data, you need some way to associate your state names with their abbreviations.
You're in luck. Another public data source does just that, but the data will need a fair amount of shaping before you can combine it with your sunglass table.
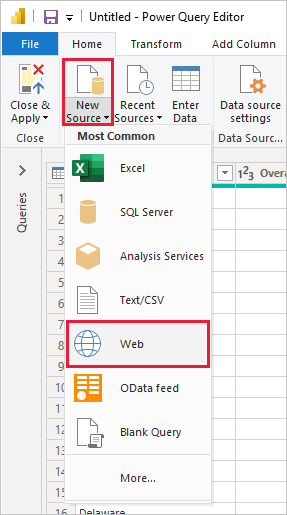
To import the state abbreviations data into Power Query Editor, select New Source > Web from the New Query group on the Home tab of the ribbon.

Build reports
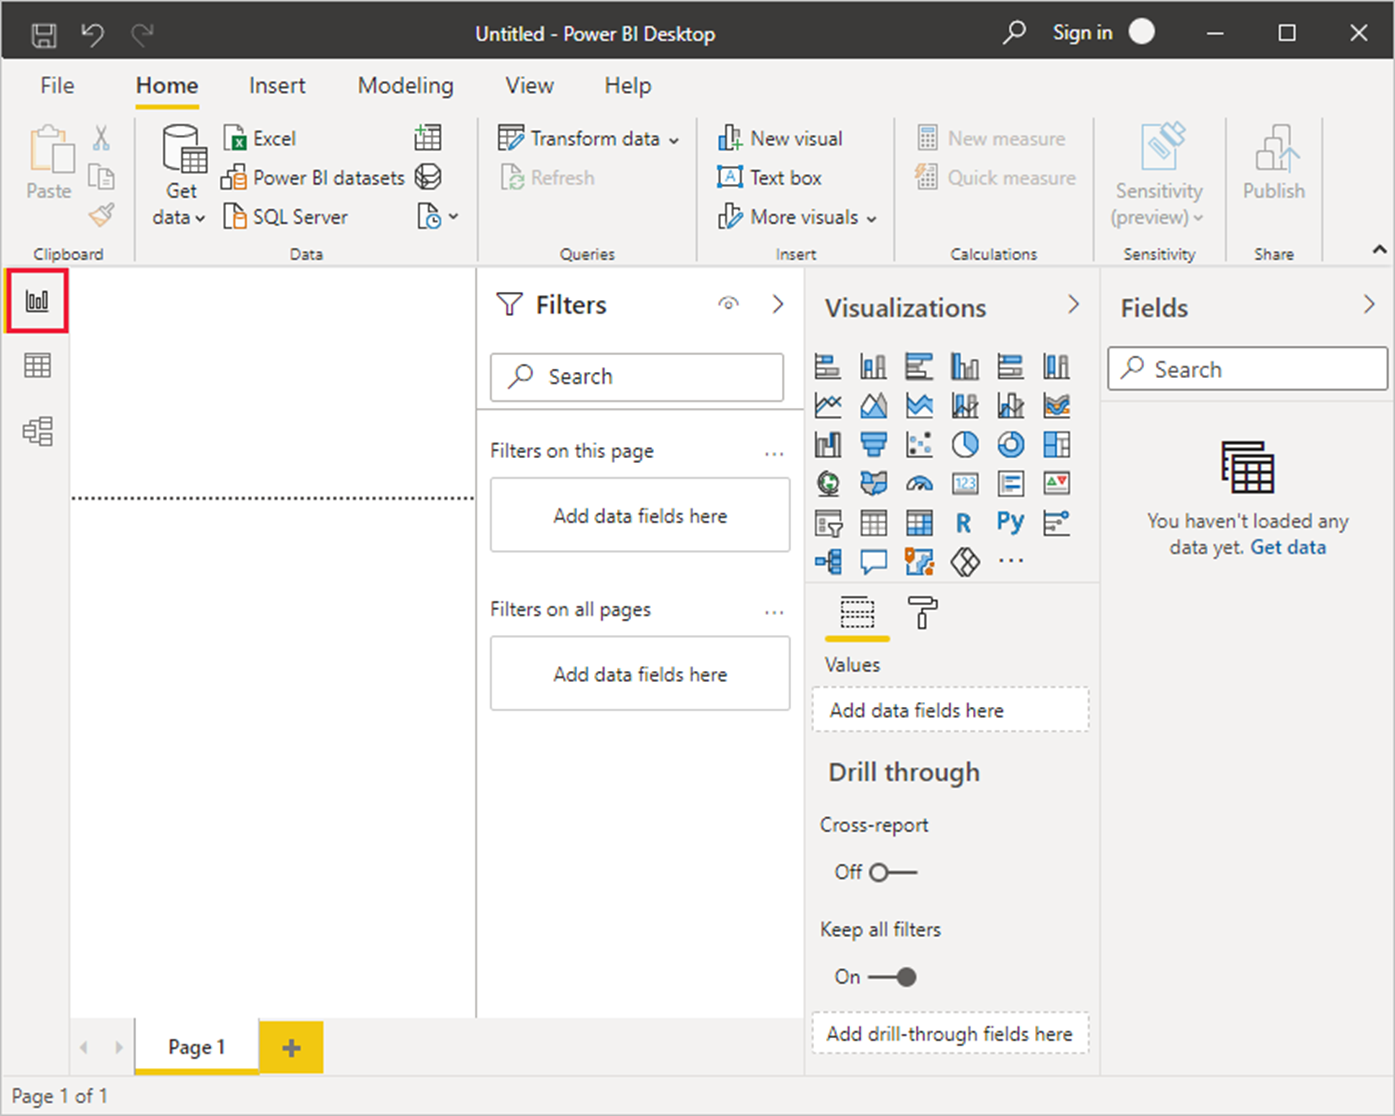
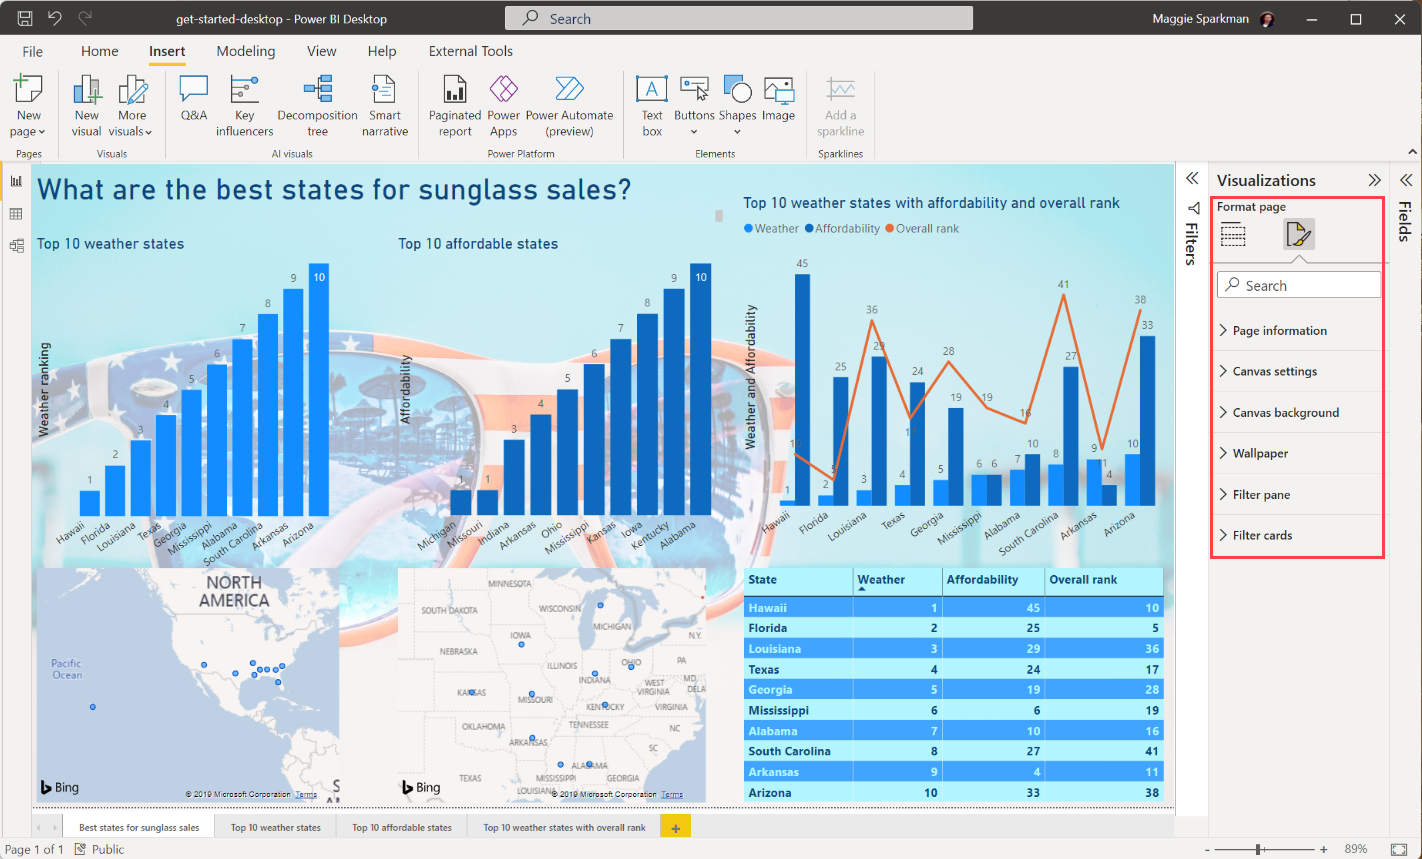
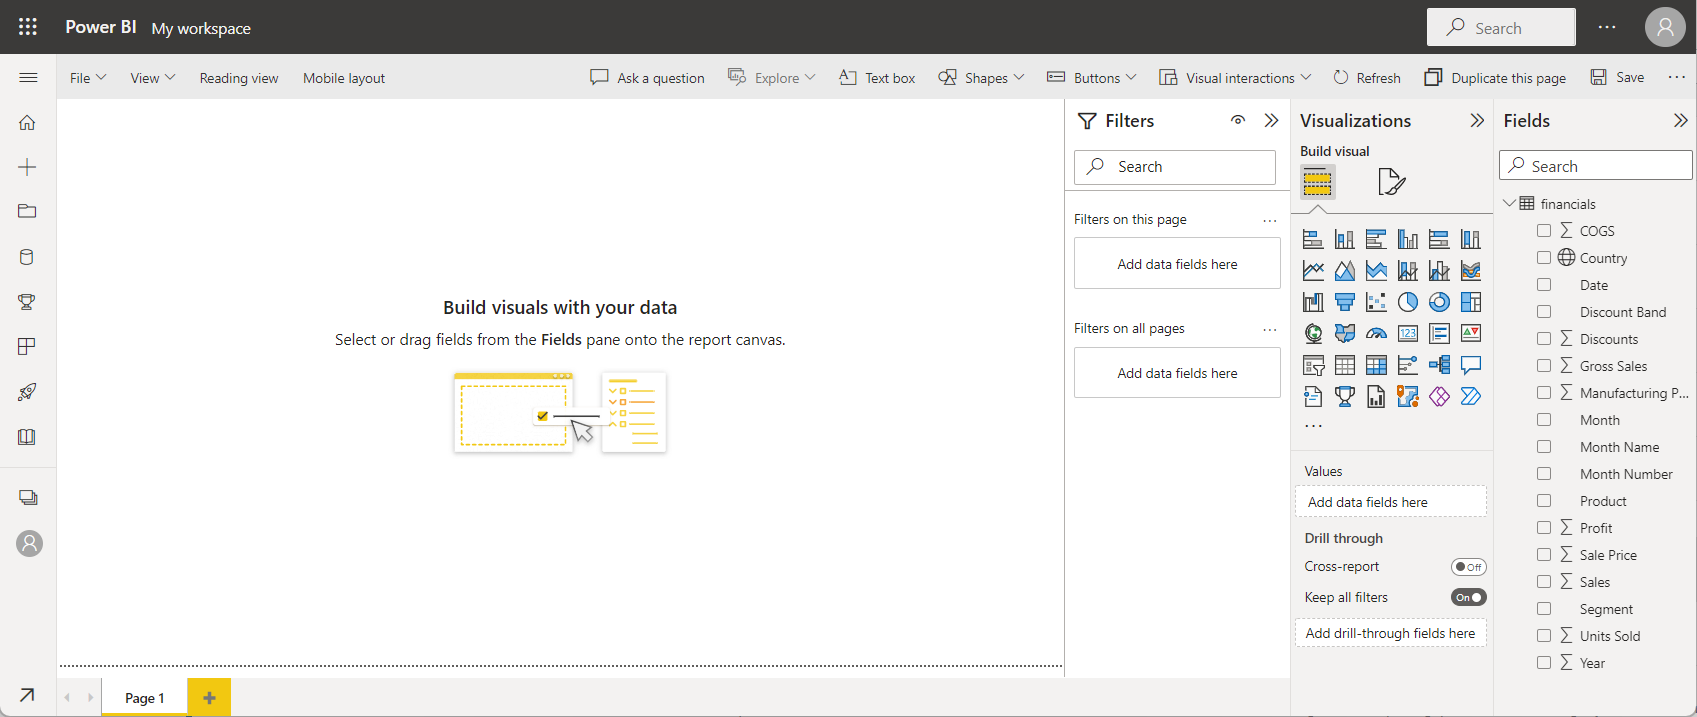
In Power BI Desktop Report view, you can build visualizations and reports. The Report view has six main areas:
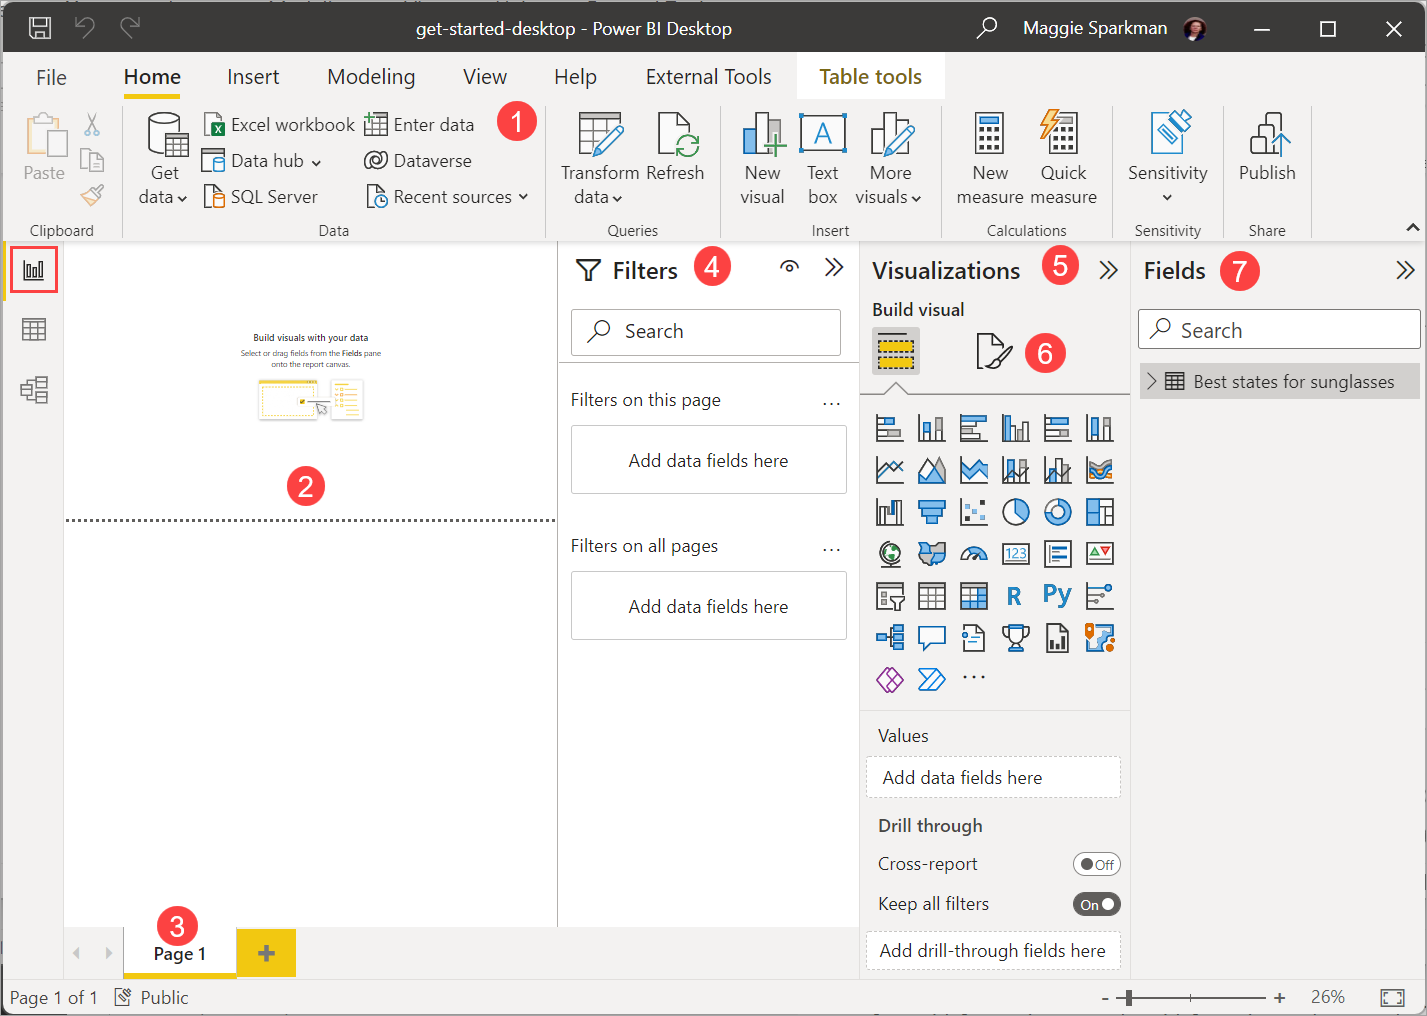
- The ribbon at the top, which displays common tasks associated with reports and visualizations.
- The canvas area in the middle, where you create and arrange visualizations.
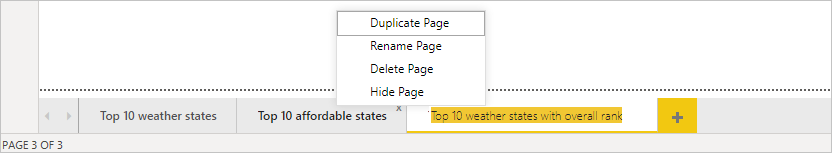
- The pages tab area at the bottom, which lets you select or add report pages.
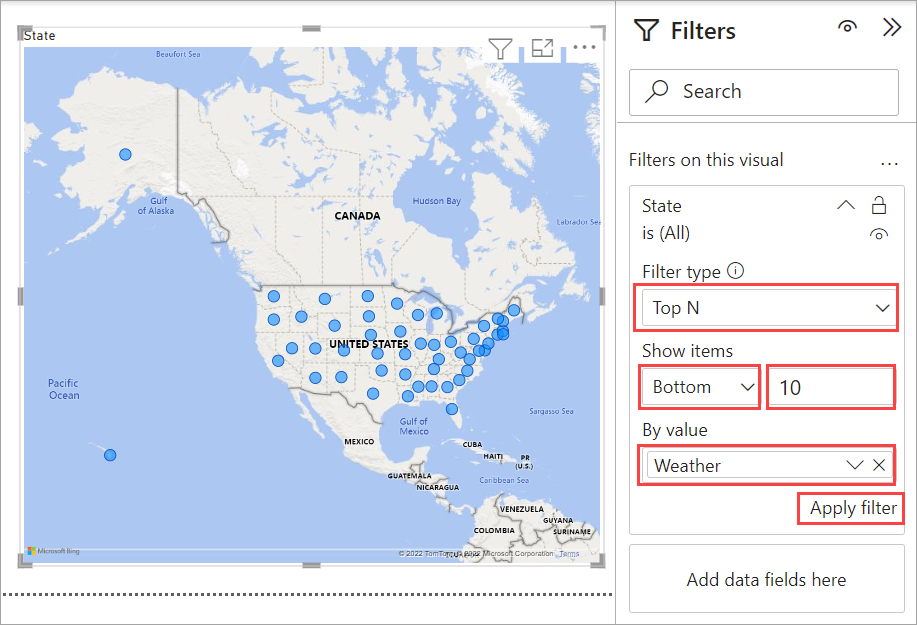
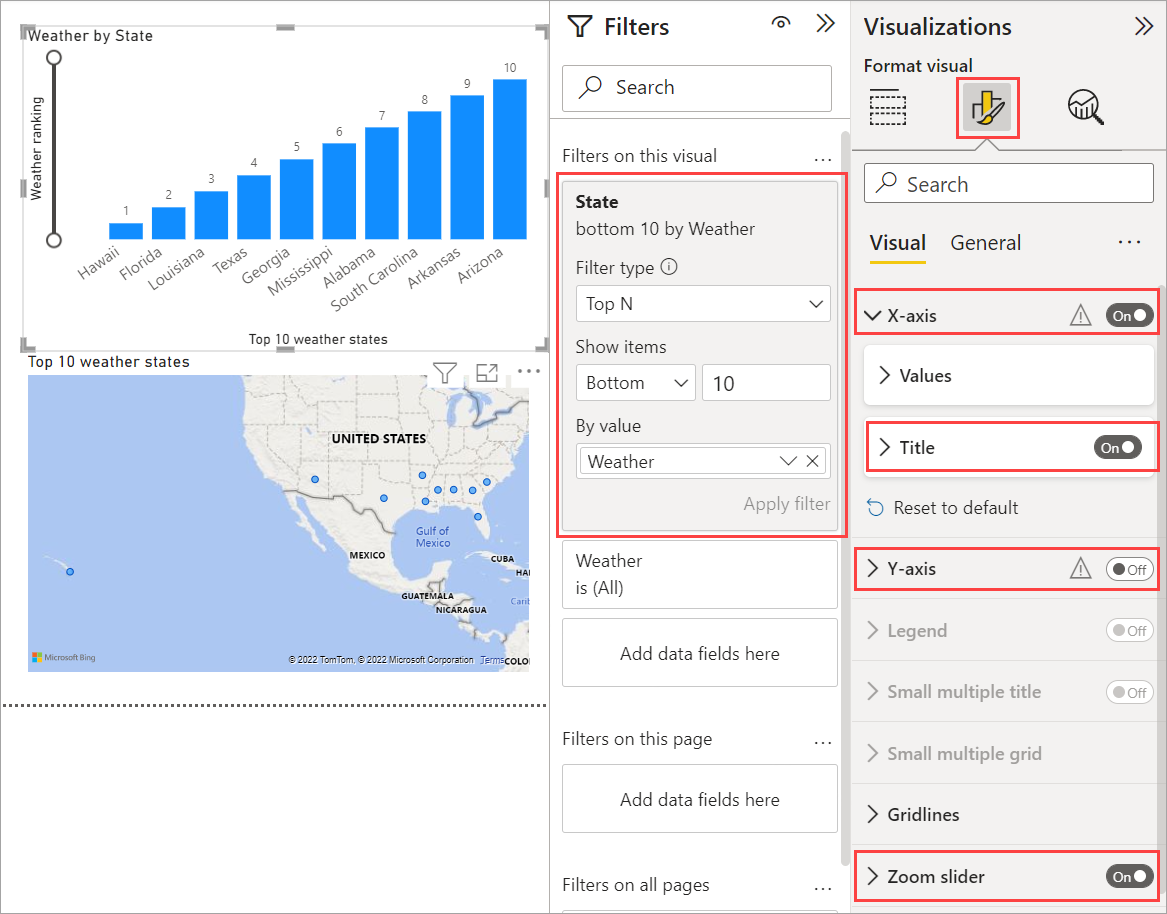
- The Filters pane, where you can filter data visualizations.
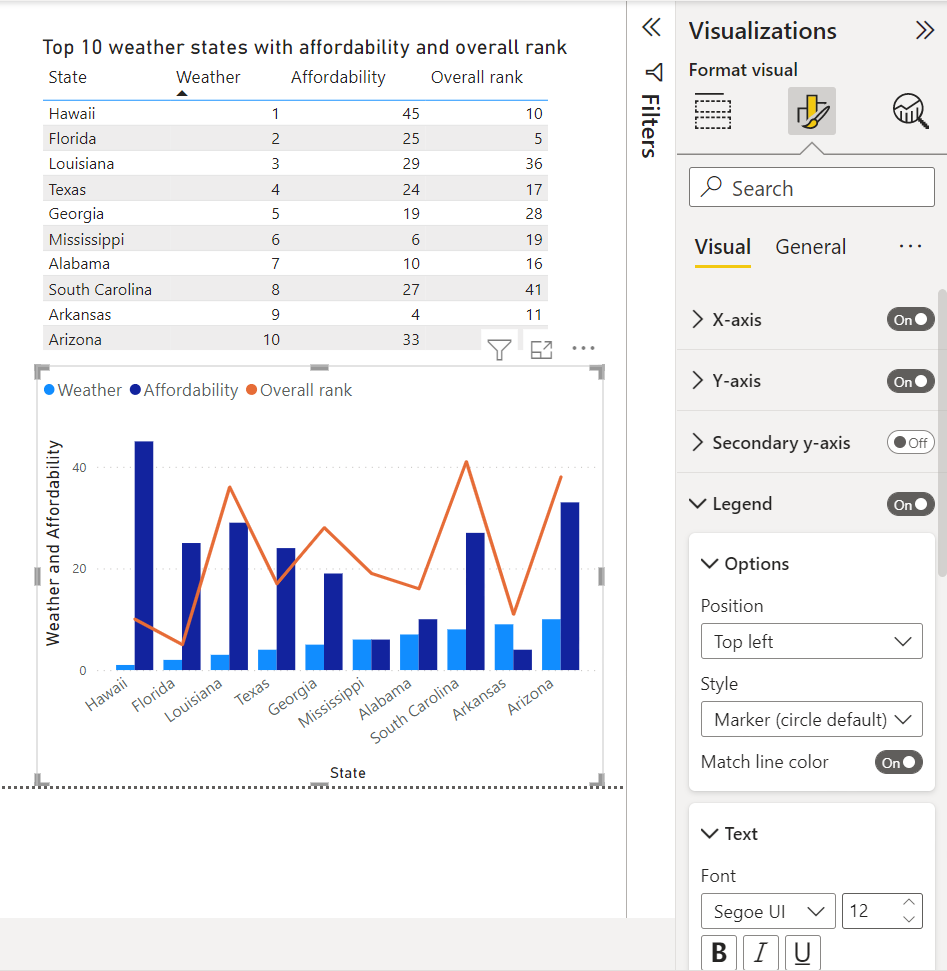
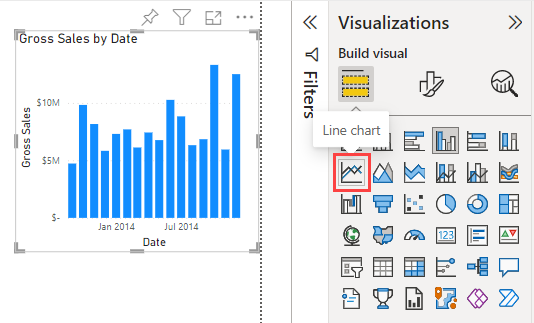
- The Visualizations pane, where you can add, change, or customize visualizations, and apply drillthrough.
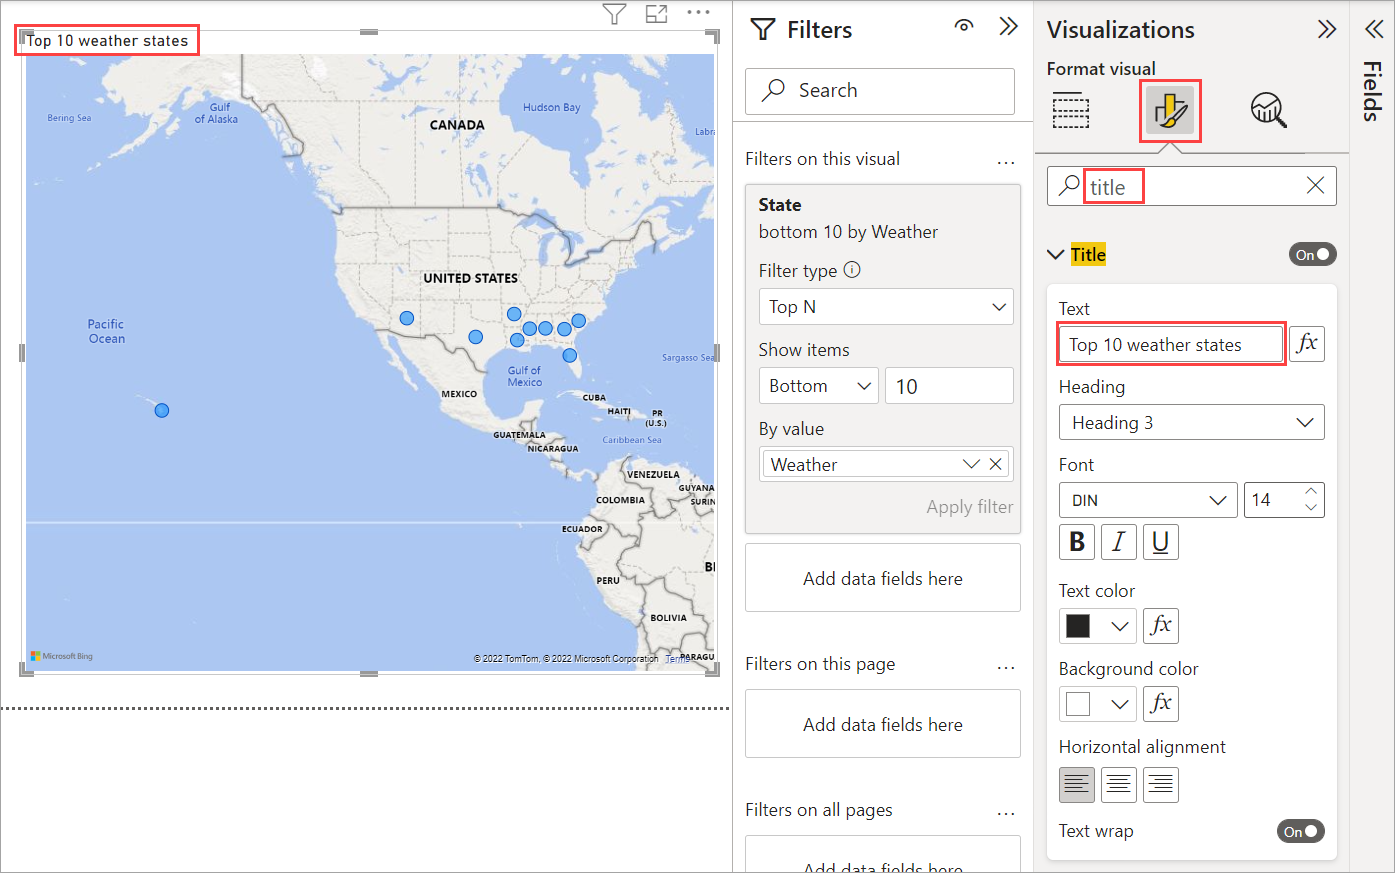
- The Format pane, where you design the report and visualizations.
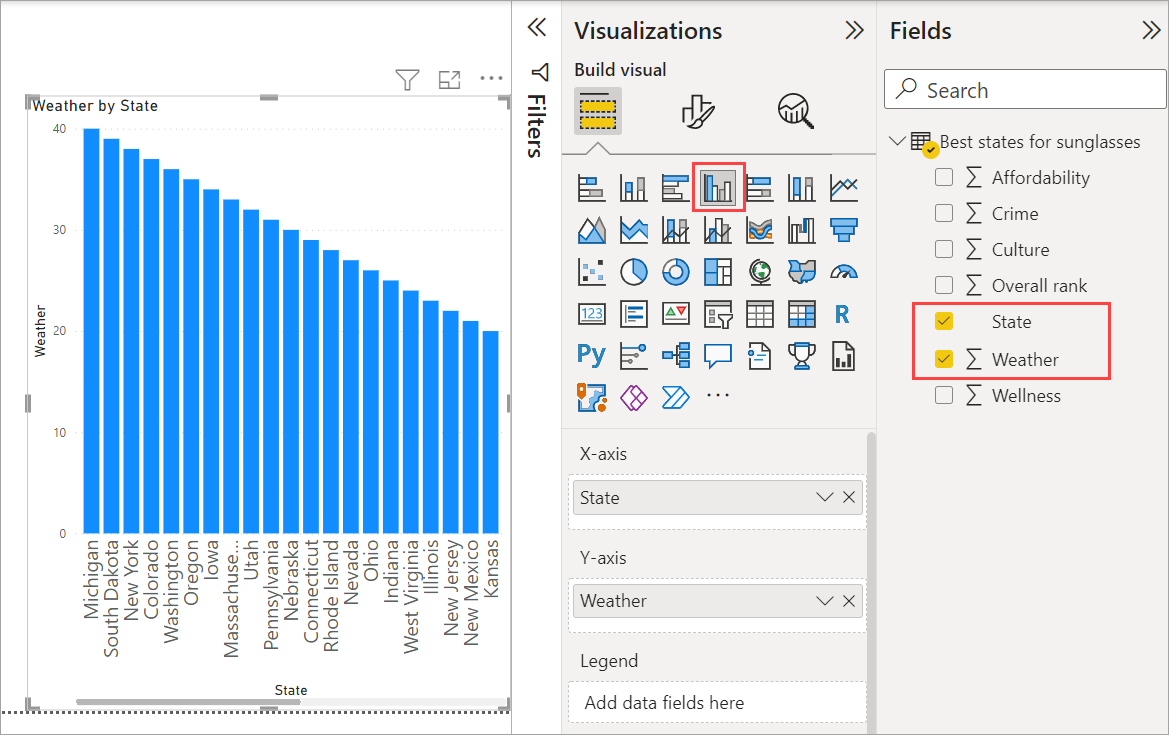
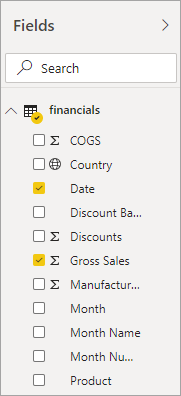
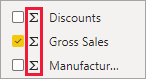
- The Fields pane, which shows the available fields in your queries. You can drag these fields onto the canvas, the Filters pane, or the Visualizations pane to create or modify visualizations.
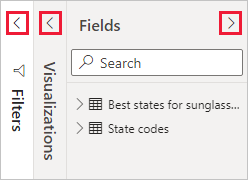
You can expand and collapse the Filters, Visualizations, and Fields panes by selecting the arrows at the tops of the panes. Collapsing the panes provides more space on the canvas to build cool visualizations.
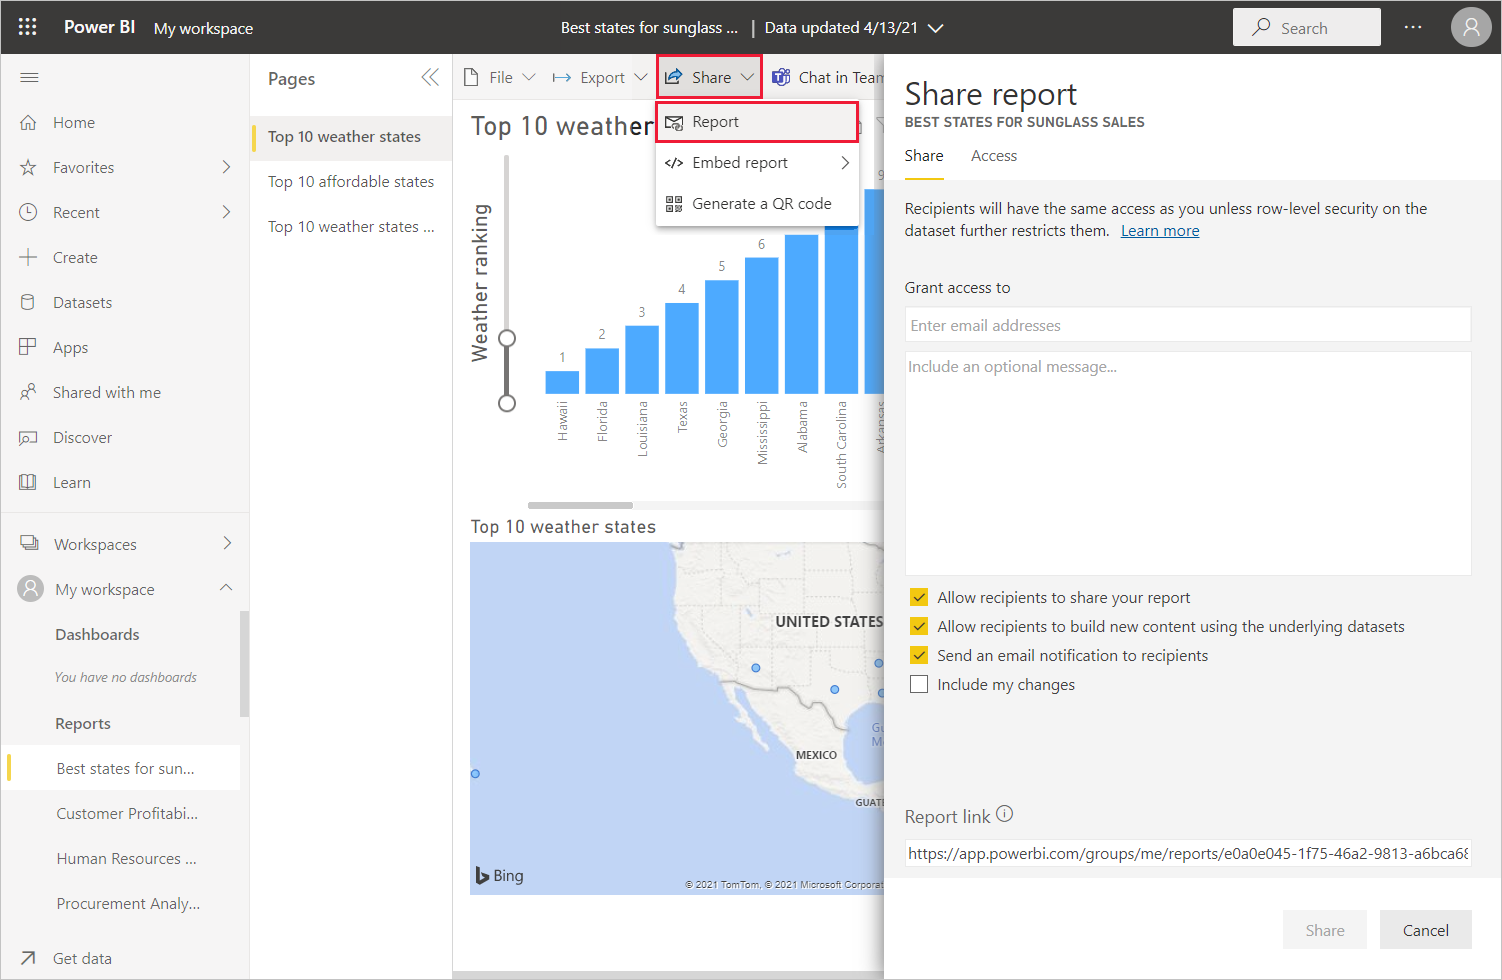
Share your work
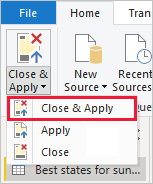
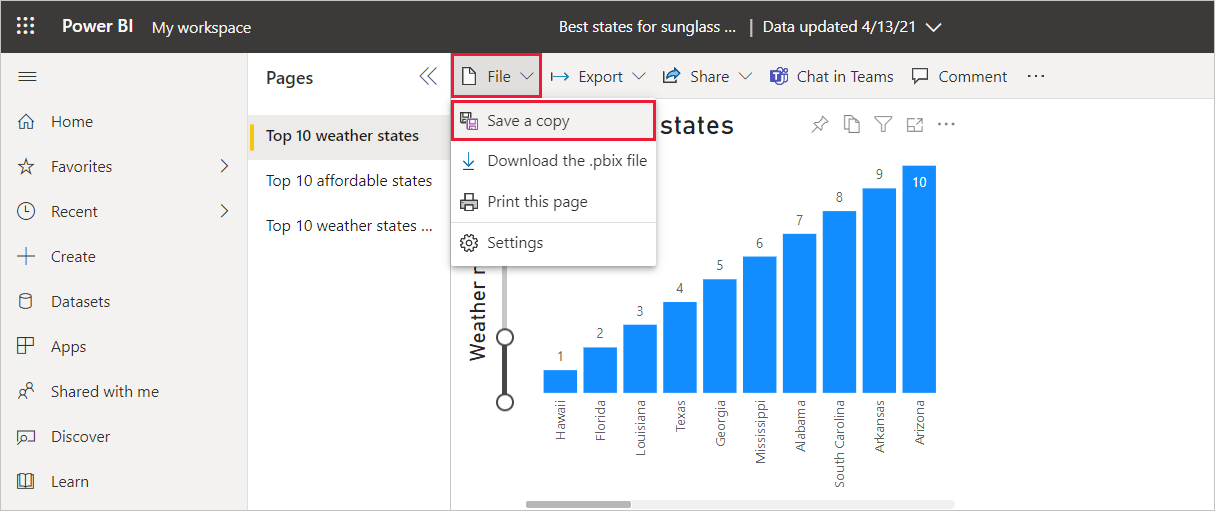
Now that you have a Power BI Desktop report, you can share it with others. There are a few ways to share your work. You can distribute the report .pbix file like any other file, you can upload the .pbix file from the Power BI service, or you can publish directly from Power BI Desktop to the Power BI service. You must have a Power BI account to be able to publish or upload reports to Power BI service.
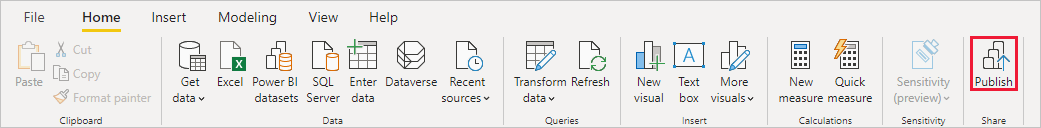
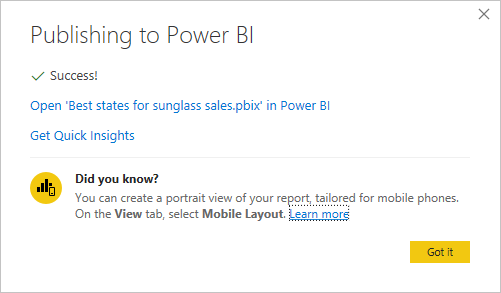
To publish to the Power BI service from Power BI Desktop, from the Home tab of the ribbon, select Publish.
Power BI service
This tutorial is an introduction to some of the features of the Power BI service. In it, you connect to data, create a report and a dashboard, and ask questions of your data. You can do much more in the Power BI service; this tutorial is just to whet your appetite. For an understanding of how the Power BI service fits in with the other Power BI offerings, we recommend reading What is Power BI.
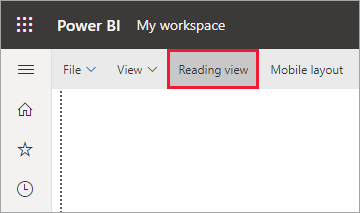
Are you a report reader rather than a creator? Getting around in the Power BI service is a good starting place for you.

In this tutorial, you complete the following steps:
- Sign in to your Power BI online account, or sign up, if you don't have an account yet.
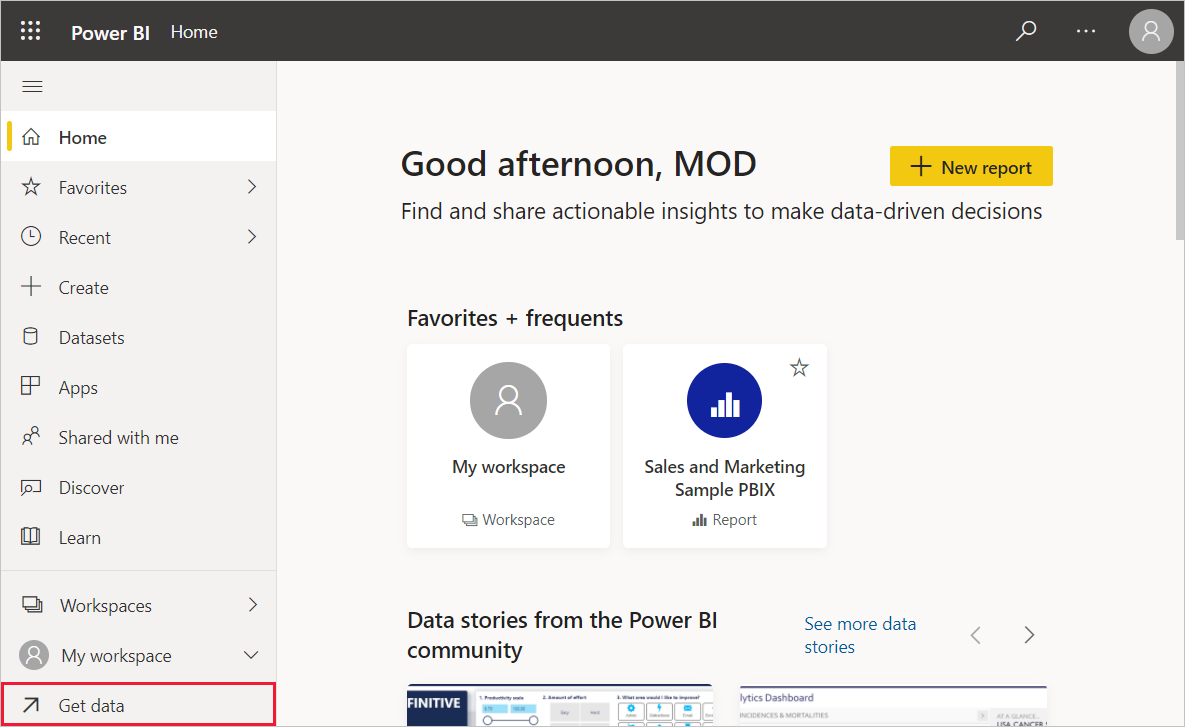
- Open the Power BI service.
- Get some data and open it in report view.
- Use that data to create visualizations and save it as a report.
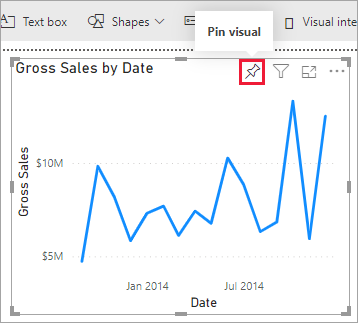
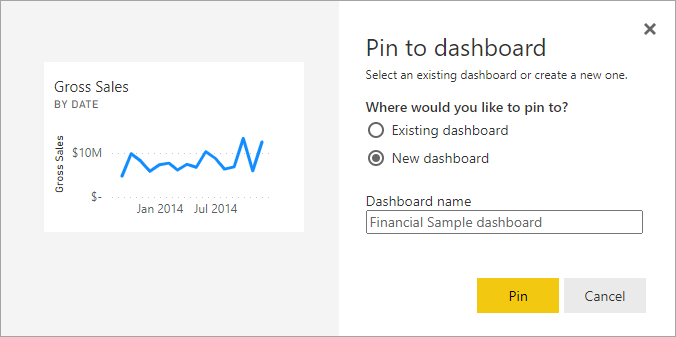
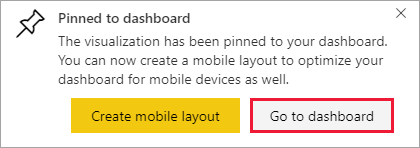
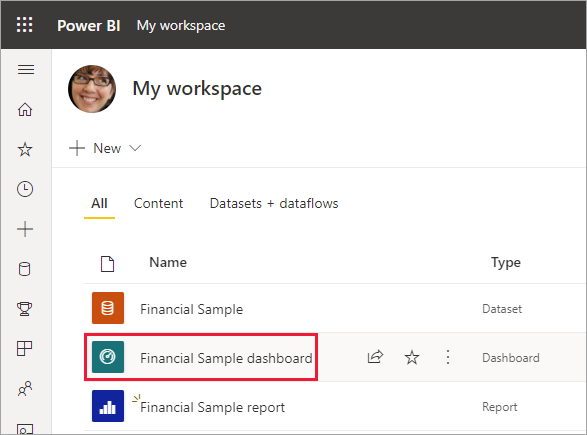
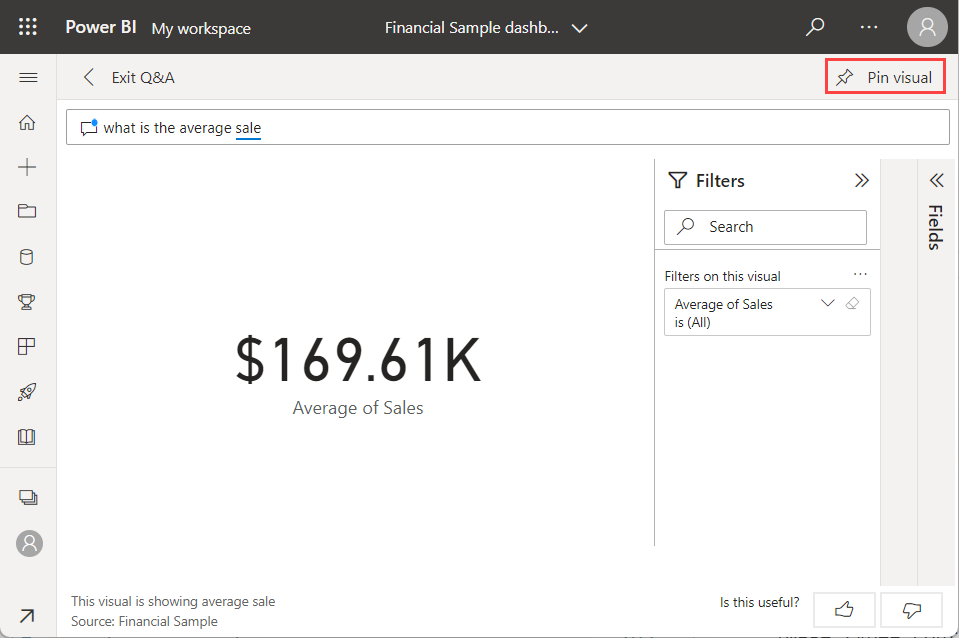
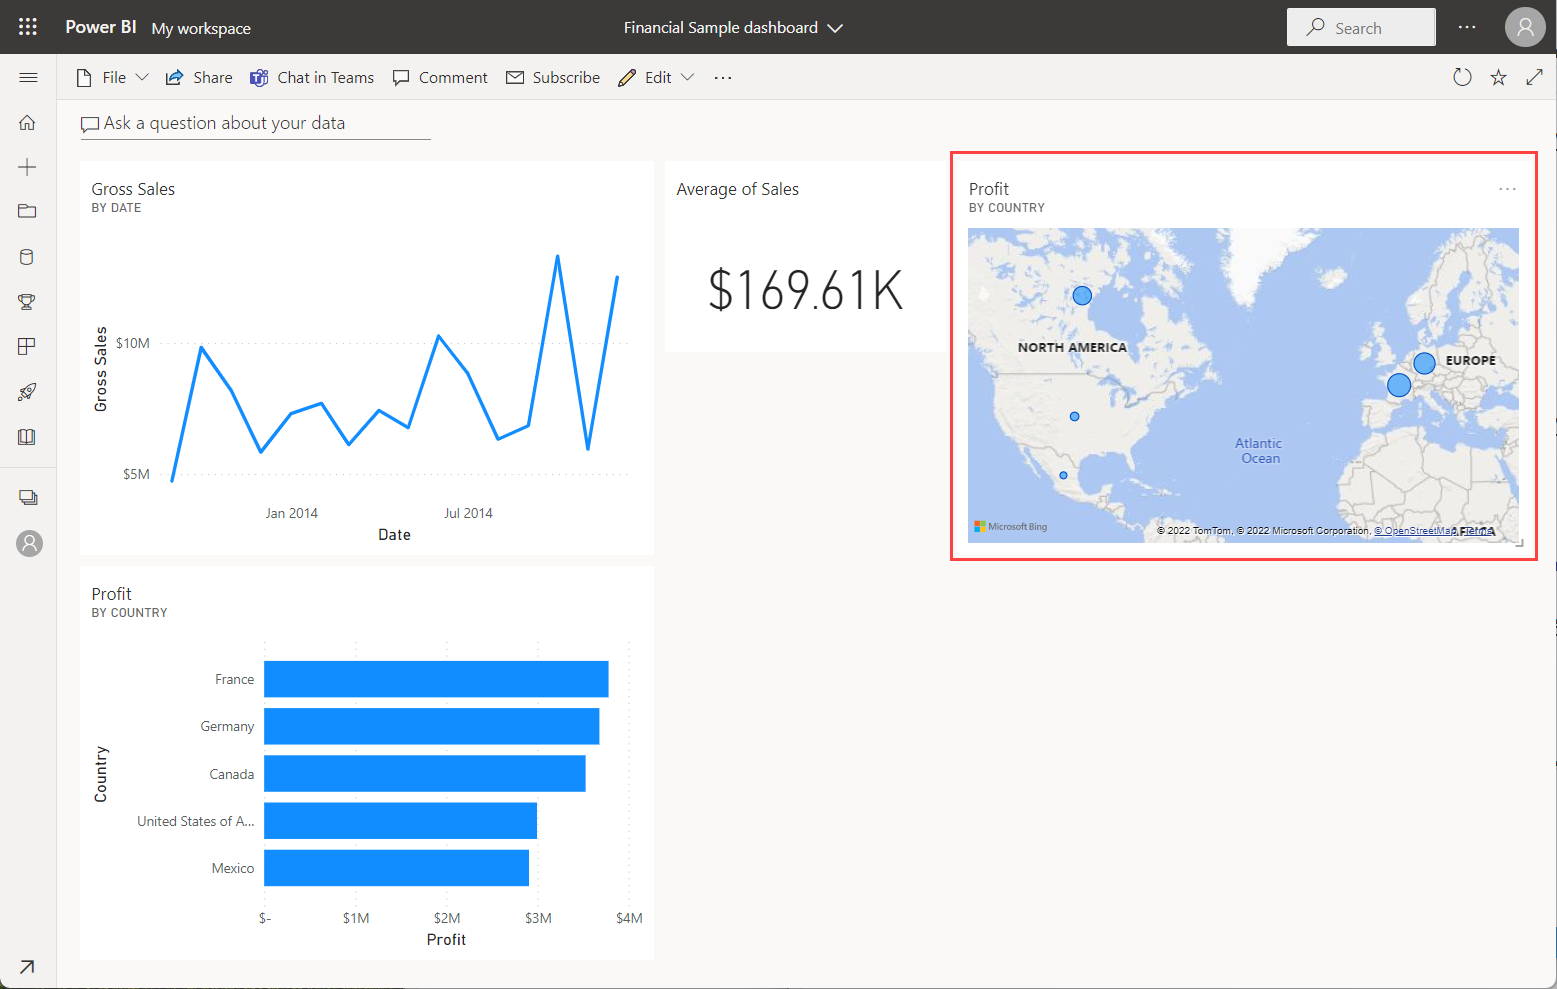
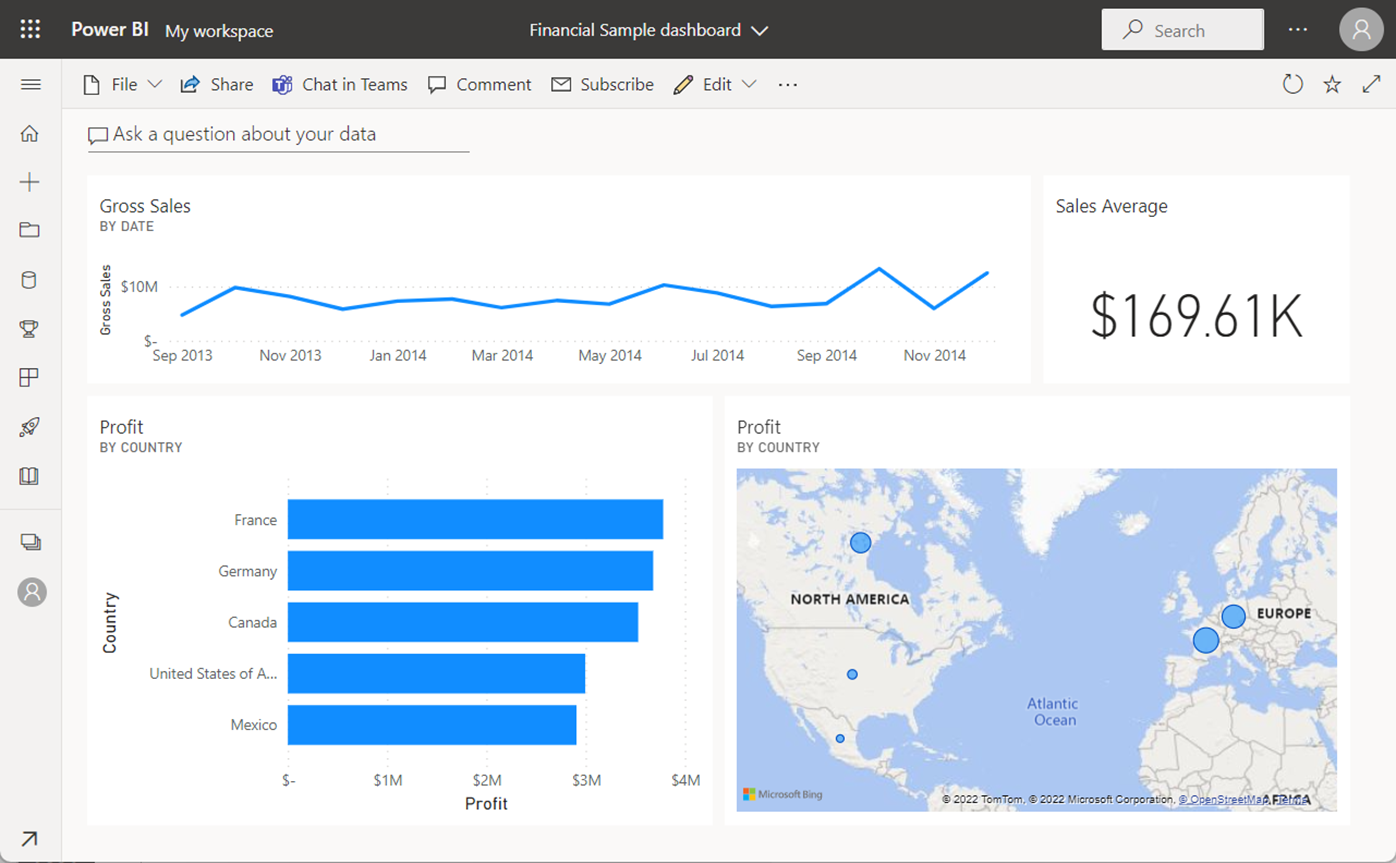
- Create a dashboard by pinning tiles from the report.
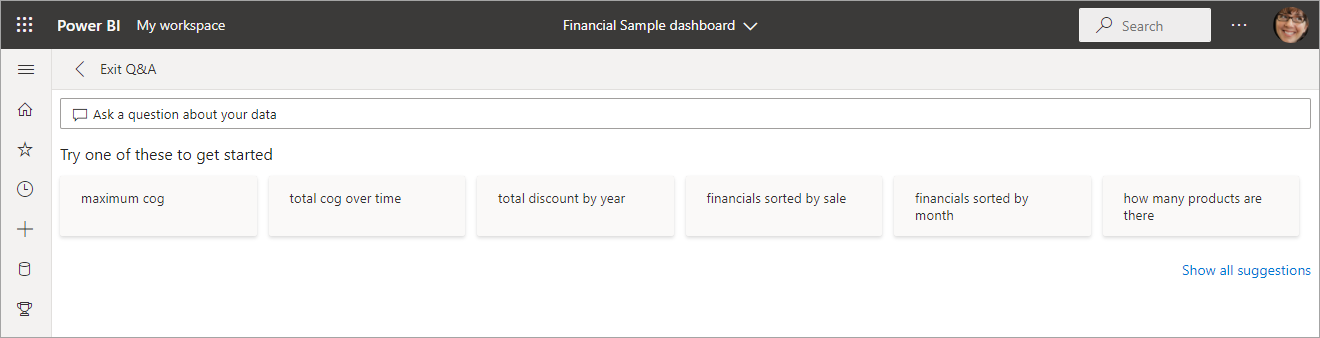
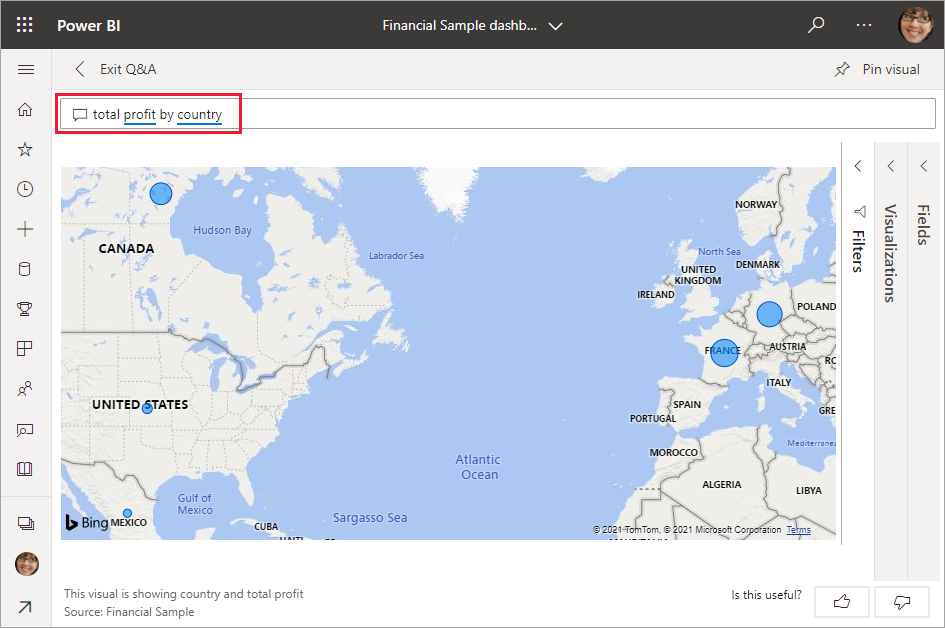
- Add other visualizations to your dashboard by using the Q&A natural-language tool.
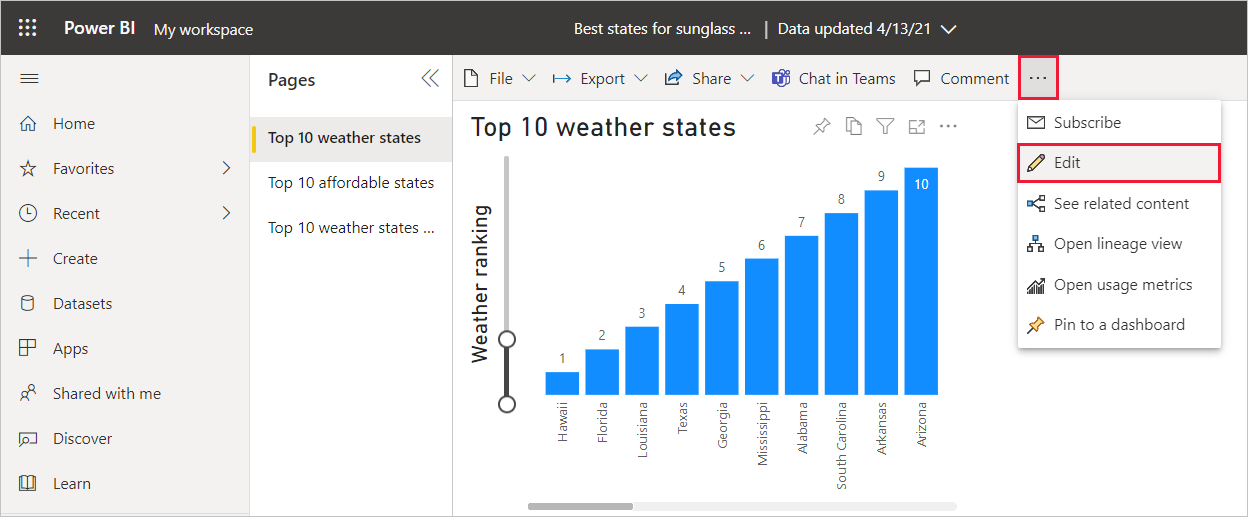
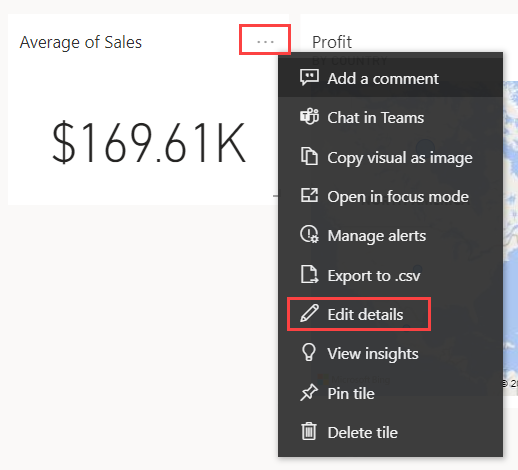
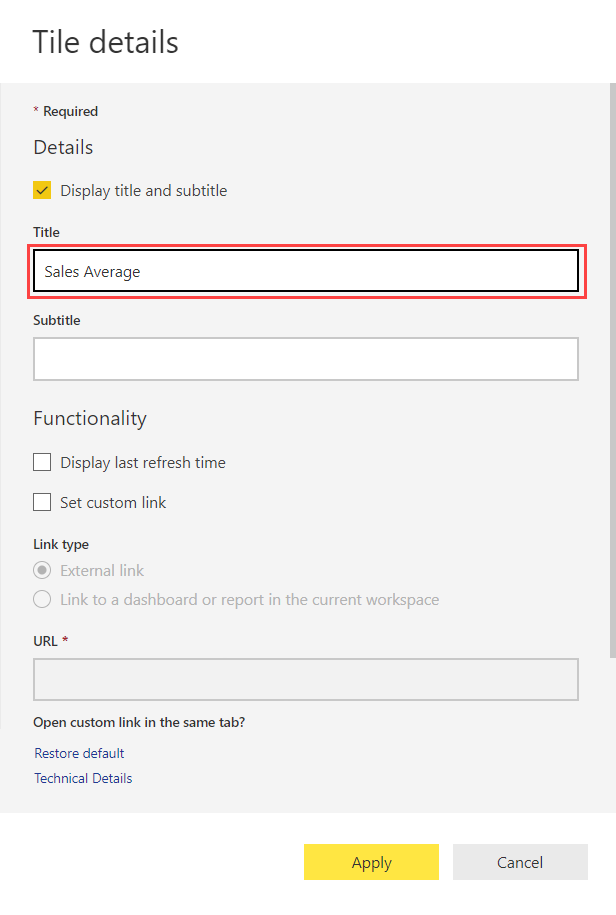
- Resize, rearrange, and edit details for the tiles on the dashboard.
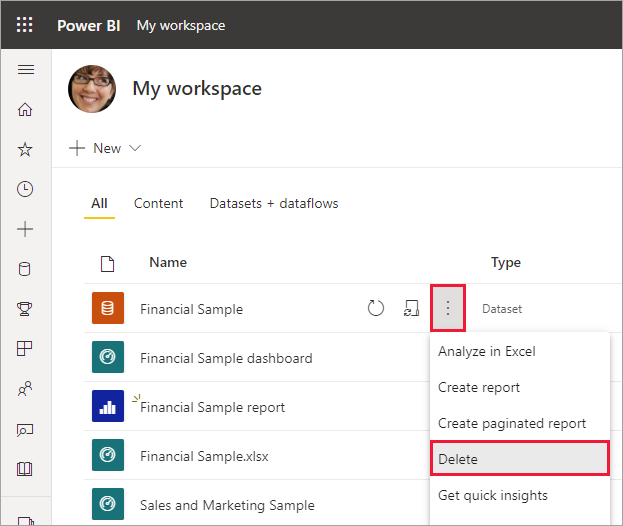
- Clean up resources by deleting the dataset, report, and dashboard.
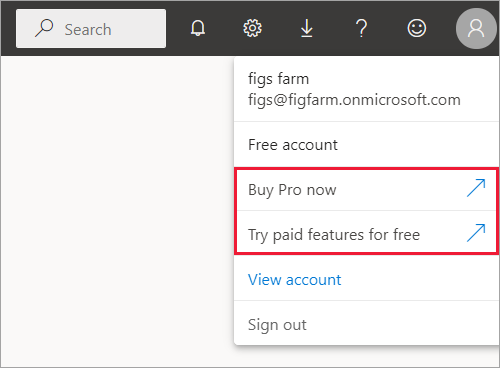
Sign up for the Power BI service
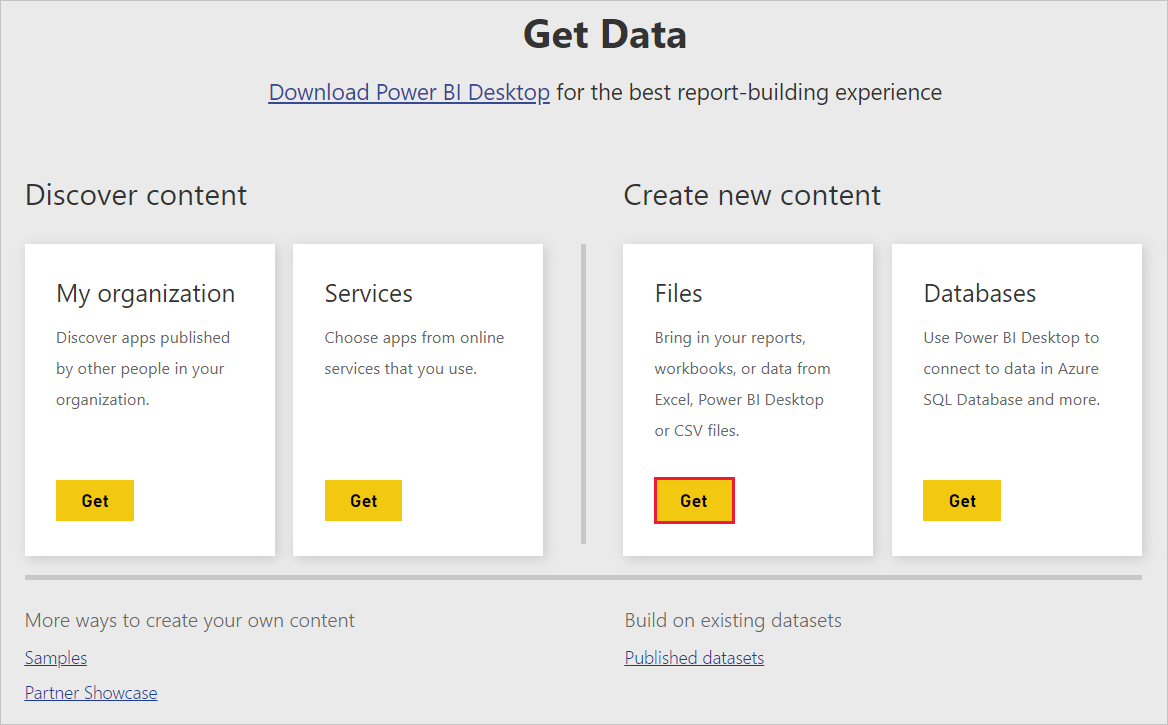
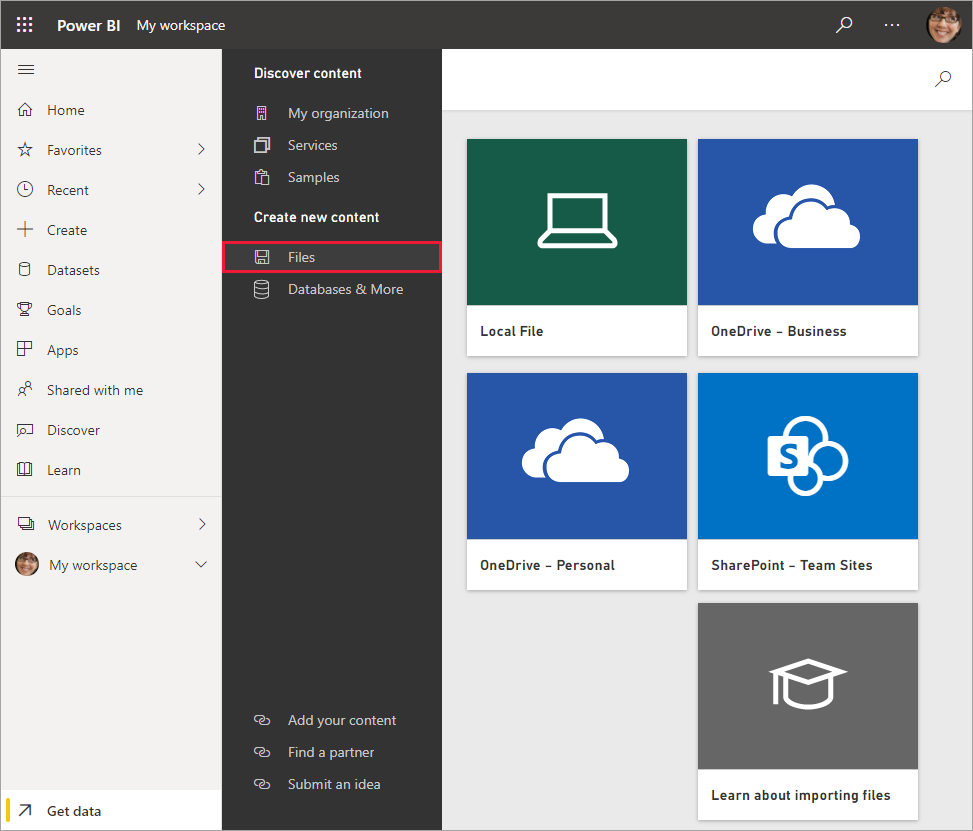
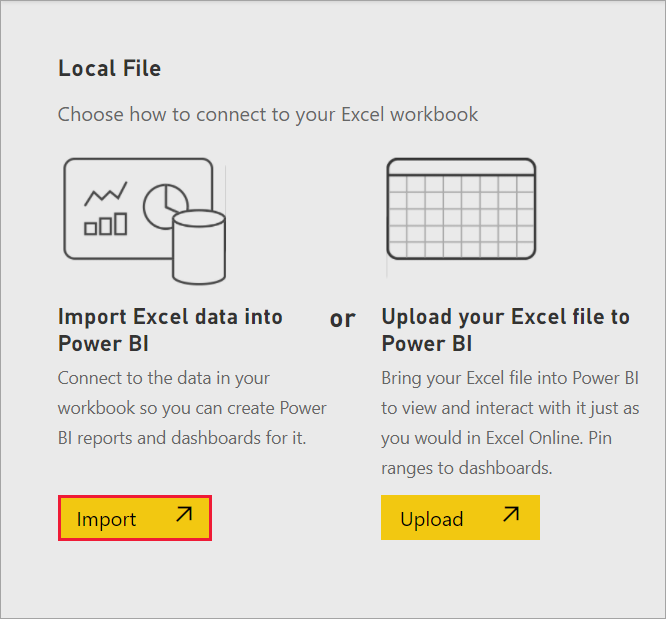
Get data
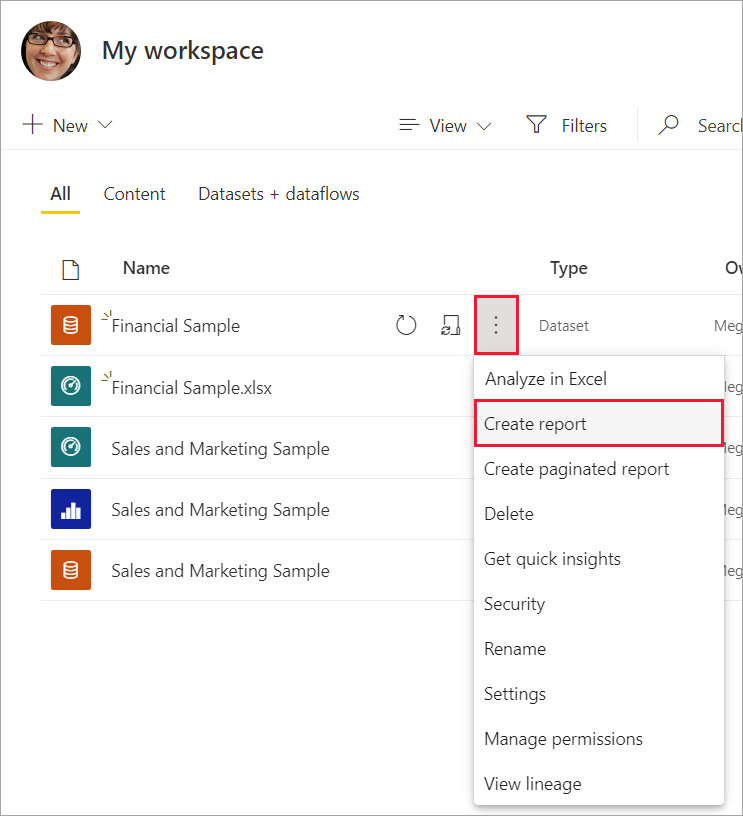
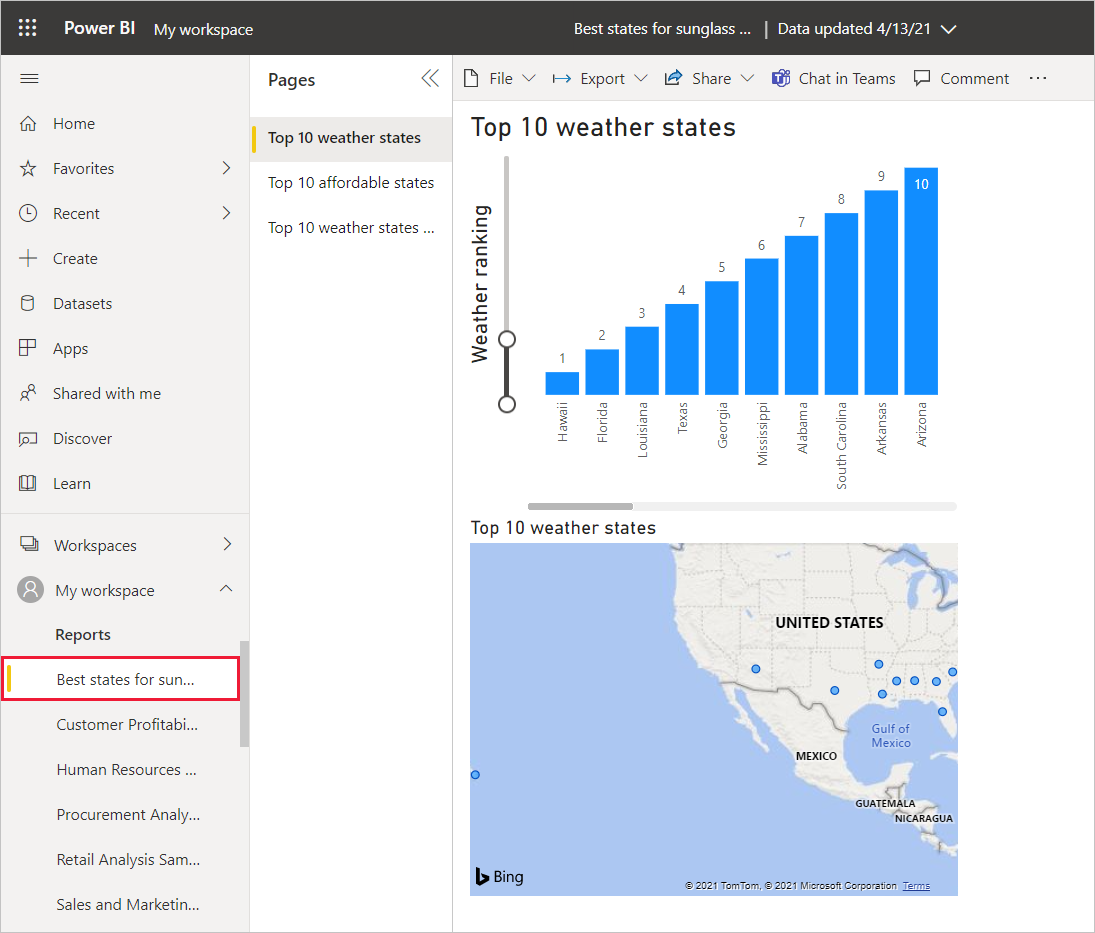
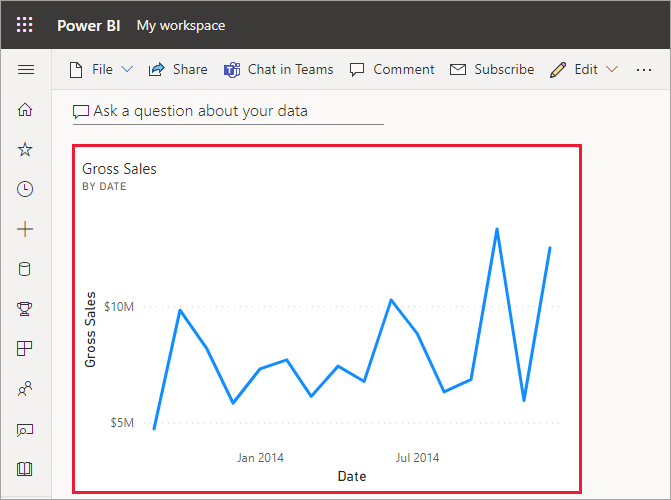
Create a chart in a report
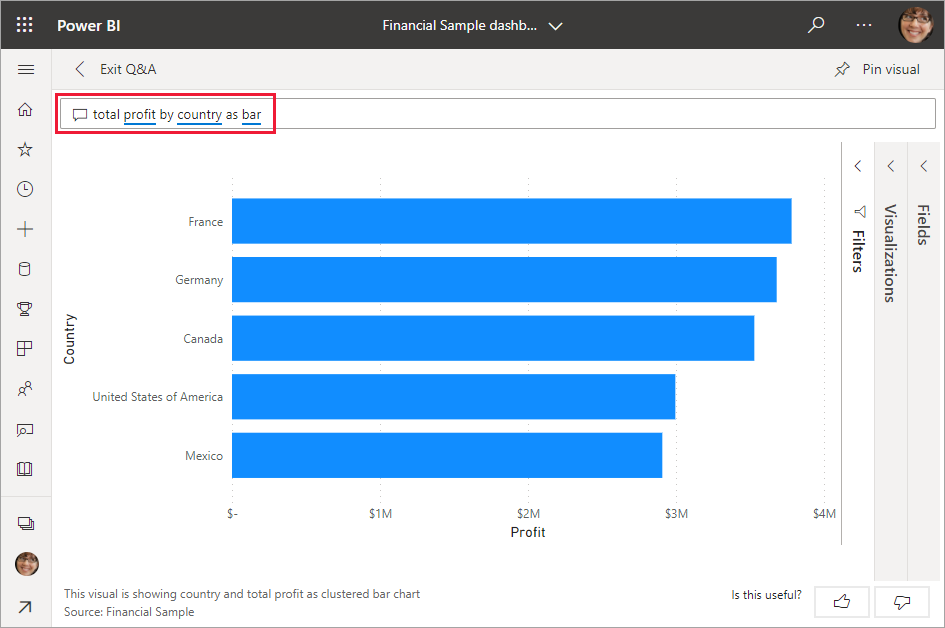
Explore with Q&A
For a quick exploration of your data, try asking a question in the Q&A question box. Q&A lets you ask natural-language queries about your data. In a dashboard, the Q&A box is at the top (Ask a question about your data) under the menu bar. In a report, it's in the top menu bar (Ask a question)
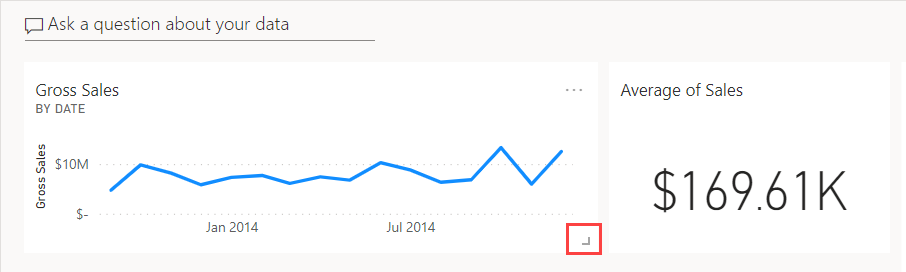
Reposition tiles
We can rearrange the tiles to make better use of the dashboard space.
Clean up resources
Now that you've finished the tutorial, you can delete the dataset, report, and dashboard.
Source: https://learn.microsoft.com/en-us/power-bi/fundamentals/desktop-getting-started